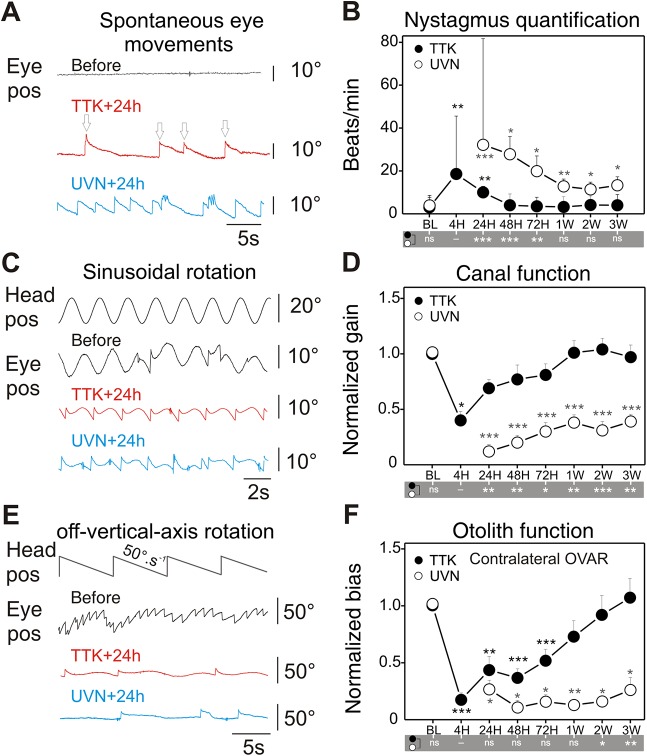
Fig. 4.
Analysis of nystagmus, canal and otolith function alterations after TTK administration and UVN. (A) Spontaneous eye movements were recorded in the dark before lesion and 24 h after TTK administration or UVN. Recordings show spontaneous eye drift (slow phase) and multiple quick phases (arrows) corresponding to pathological nystagmus. (B) Comparison of the nystagmus quantified from the TTK (n=11) and UVN (n=6) mice groups during the 3 weeks following the lesion. (C) Raw traces of eye movements observed during sinusoidal table rotation in yaw plane at 0.5 Hz and 30°/s sinusoidal rotation, before and 24 h after TTK or UVN. Note the reduction in amplitude of the eye movements and asymmetry in the response towards the ipsilesional side or contralateral rotation (here ipsi is up). (D) Quantification of the aVOR gain following TTK and UVN. To ease comparison, data are normalised to the pre-lesion values (raw values are reported in Table 2). (E) MOR were measured during off-vertical axis rotation at 50°/s. At 24 h after TTK and UVN, note the absence of the horizontal beating of the eye normally observed. (F) Quantification of the MOR bias following TTK and UVN. Data are normalised to the pre-lesion values. Results are presented as mean±s.e.m. If present, statistical significance is shown comparing each value to the base line (BL) value (repeated measures ANOVA and post-hoc Tukey tests, see Materials and Methods section). In the grey area under B, D and F, statistical differences between UVN and TTK values are reported (two- or three-way ANOVA and post-hoc Tukey tests, see Materials and Methods section). Statistics are represented as *P<0.05; **P<0.01; ***P<0.001; n.s., not specified. In all cases, the TTK population improved after 1 week and fully recovered after 3 weeks, whereas UVN mice remained pathological.

