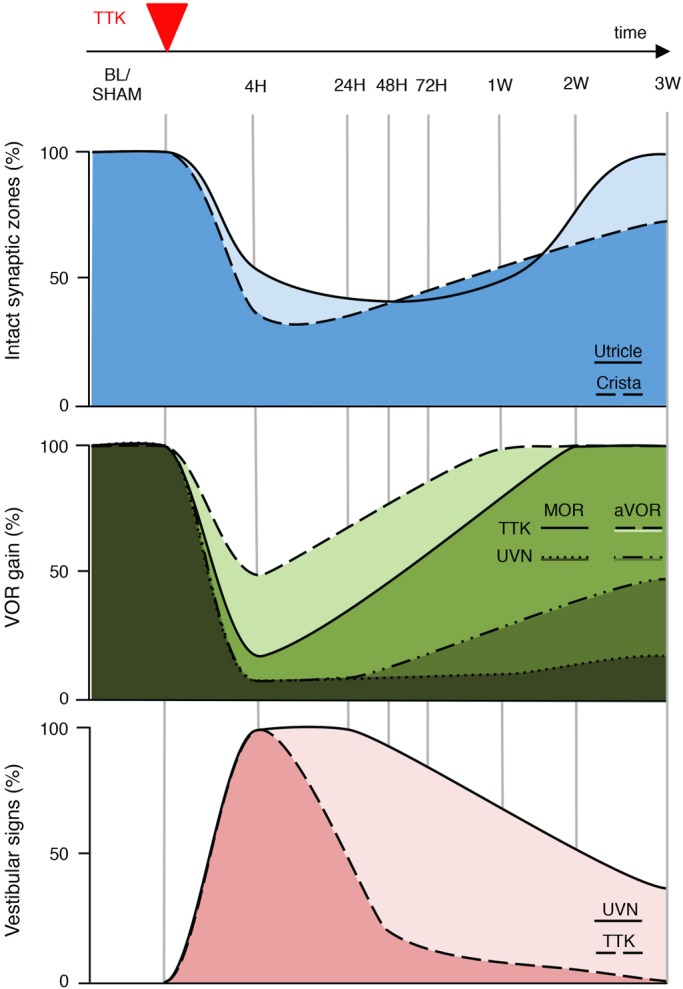
Fig. 6.

Correlation grid between vestibular primary synapses afferentation state and signs of vestibular functional alterations. Upper traces: schematic representation of the percentage of intact synapses in the utricle (light blue) and crista (deep blue), drawn on the basis of CtBP2 expression in the sensory epithelia at each of the investigated time points (Fig. 3). Middle traces: schematic representation of the percentage of aVOR [dashed line (or light green) for TTK and dash-dotted line (or lighter dark green) for UVN] and MOR [full line (or green) for TTK and dotted line (or darkest green) for UVN] gains, drawn on the basis of the aVOR measurements shown in Fig. 4. Lower traces: schematic representation of the percentage of posture-locomotor alterations in the UVN (light pink) and TTK (dark pink) mice, drawn on the basis of the vestibular signs displayed in Fig. 5A.
