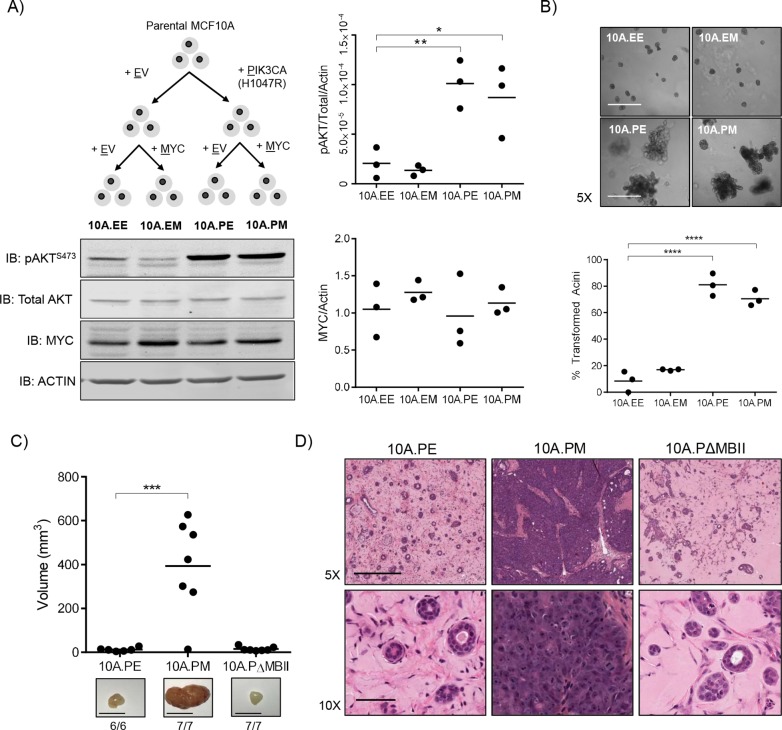
Fig. 1.
In vivo transformation of MCF10A cells is dependent on active PI3K signalling, deregulated MYC and the conserved MBII region. (A) Schematic overview of the generation of an isogenic panel of MCF10A cell lines. Immunoblotting was performed against pAKTS473, total AKT, MYC and actin and quantified using ImageJ (n=3). One-way ANOVA with Bonferroni post-test for multiple testing. **P≤0.01, *P≤0.05. (B) The MCF10A isogenic panel cultured in Matrigel for 12 days. Images were acquired on day 12 and quantified based on an assessment of acinar circularity and size. Individual mean values from three biological replicates are shown; ****P≤0.0001, one-way ANOVA with Bonferroni post-test for multiple testing. Scale bars: 500 μm. (C) Individual tumour volume measurements from 10A.PE (n=6), 10A.PM (n=7) and 10A.PΔMBII (n=7) xenografts 49 days after injection. Representative images and take rate (mass formed/mouse injected) is indicated below each image. Scale bar: 0.5 cm. ***P≤0.001, one-way ANOVA with Bonferroni post-test for multiple testing. (D) Histology samples from xenografts in (C) stained with H&E. Representative images are shown. Scale bar for 5× images: 50 μm. Scale bar for 10× images: 500 μm.

