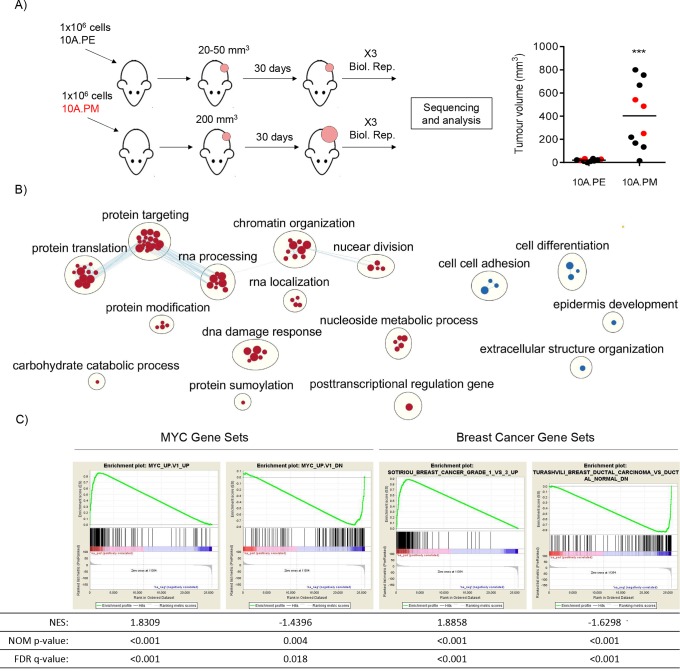
Fig. 3.
10A.PM tumours have MYC and invasive breast cancer expression signatures. (A) Female NOD-SCID mice were injected with 10A.PE or 10A.PM cells and allowed to form tumours (left). For RNA-seq analysis, 10A.PE growths (n=3) and actively growing10A.PM tumours (n=3) were harvested (right, indicated in red). ***P≤0.001, unpaired, two-tailed t-test. (B) Changes in gene expression, relative to 10A.PE xenografts, were ranked and tested for enrichment in GO Biological Process gene sets. The 10A.PM upregulated or downregulated genes that were significantly enriched in a GO Biological Process gene set are represented as red or blue circles, respectively (all data are provided in Table S2). Edges represent the number of overlapping genes within each gene set and node size represents the number of genes within a single gene set. Finally, clusters of gene sets and annotations were created using clusterMaker2 and AutoAnnotate Cytoscape applications. Data has been filtered (for visualisation) to show highest/lowest enriched GO processes (Reimand et al., 2019). (C) The gene expression data were analyzed by GSEA with MYC and IDC signature data sets. Gene sets used are labelled on the top of each enrichment plot (all data is provided in Table S2). NES, normalised enrichment score (the enrichment score for the gene set after it has been normalised across analysed gene sets). NOM P-value, the statistical significance of the enrichment score. The nominal P-value is not adjusted for gene set size or multiple hypothesis testing and, therefore, is of limited use in comparing gene sets. FDR q-value, false discovery rate (i.e. the estimated probability that the normalised enrichment score represents a false-positive finding).

