Fig. 5.
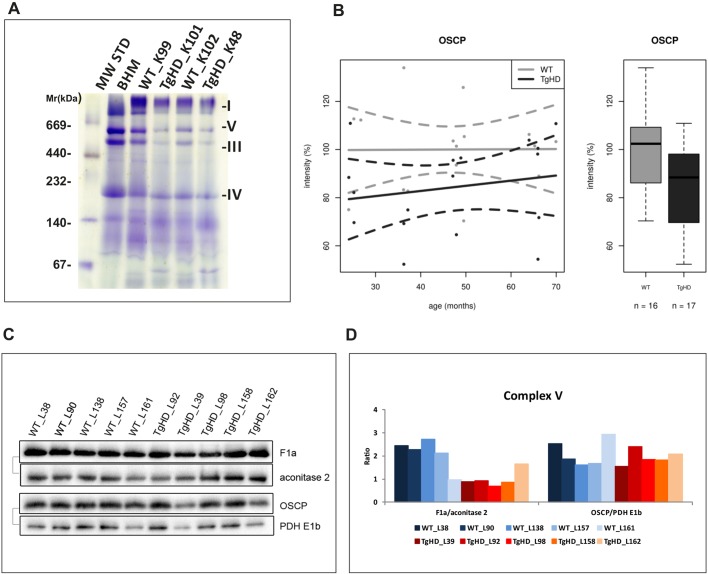
Impairment of OXPHOS protein content in TgHD minipig skeletal muscle. (A) Blue-native PAGE analysis of isolated skeletal muscle mitochondria from TgHD minipigs and WT controls; representative analysis at the age of 48 months is shown. Decreased amounts of RCCI, V, III and IV was found in TgHD muscle. Positions of the respiratory chain complexes are indicated on the left. (B) Decreased levels of OSCP in TgHD animals compared with WT animals (P=0.0176). Intensity in panel B represents the signal of proteins analyzed by western blot and quantified using the Quantity One 1-D Analysis Software (Bio-Rad). In the box-whisker plots, median and quartiles are displayed. Circles represent outliers that are further than 1.5IQR from the corresponding quartile. Whiskers show the range of non-outliers. Boxes represent the TgHD and WT groups that consist of all animals in all ages between 24 and 66 months; numbers of analyzed samples are indicated. (C) Representative western blot analysis of the OSCP and F1a subunits of RCCV at the age of 66 months; the respective protein pairs from the same blot are indicated with a bracket. (D) Quantification of normalized western blot signal from 5 TgHD and 5 WT muscles (shown in panel C) using Quantity One 1-D Analysis Software (Bio-Rad).

