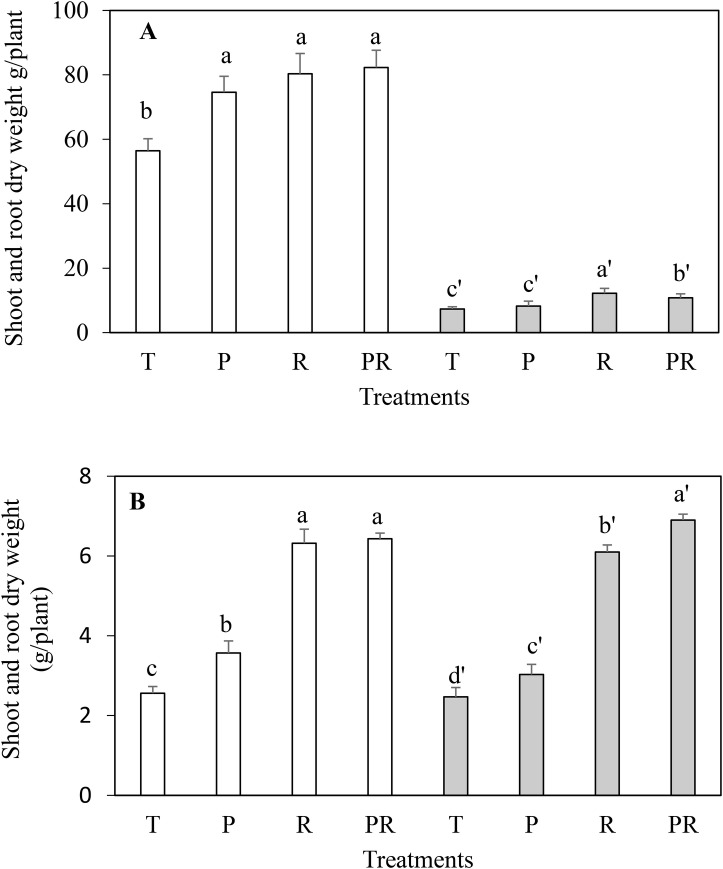
Fig. 2.
Shoot dry weight (colored in white) and root dry weight (colored in gray) of faba bean (A) and wheat (B) submitted to different treatments. T, uninoculated control; P, PGP only (PGP27+BS17); R, rhizobia only (RhOF4+RhOF155); PR, PGP+rhizobia. Means (±s.d.) within the same graphic followed by different letters are significantly different at P<0.05.

