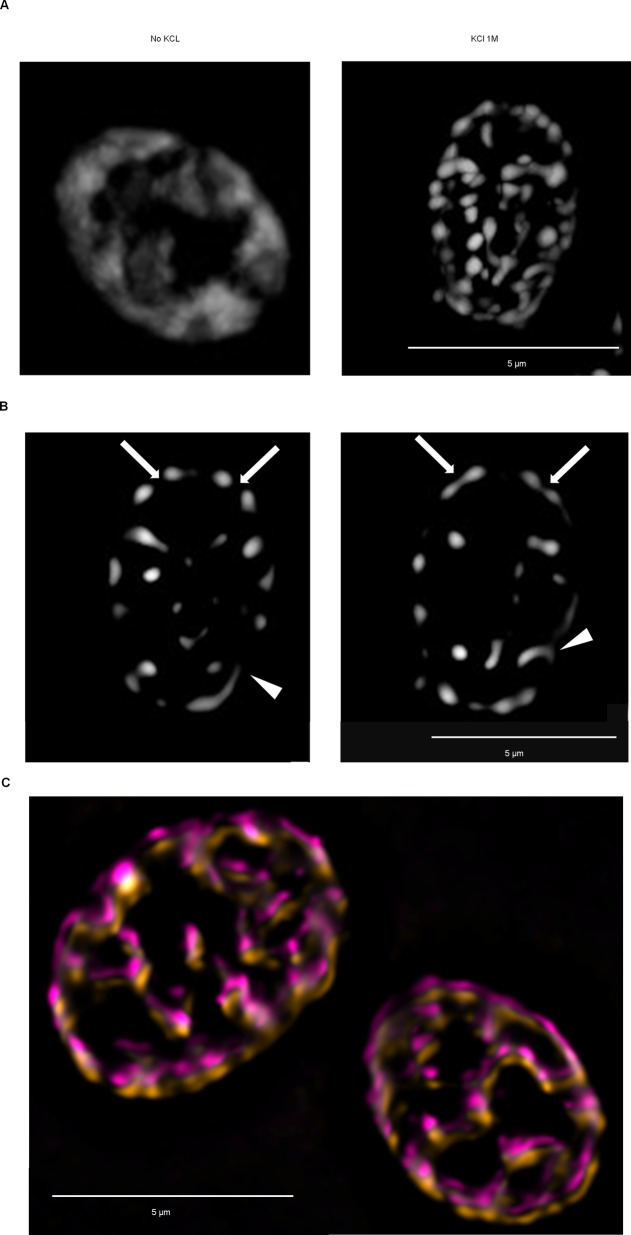
Fig. 2.
SIM reveals bridges between OSFs as well as small OSF protuberances. Cells producing the Ssa1-DDR protein were collected in the logarithmic phase of growth from YP-Gly medium, and either subjected or not subjected to hyperosmotic shock with 1M KCl in the same medium. (A) Maximum intensity projection of a representative shocked and non-shocked cell. (B) Selected optic sections from the same shocked cell shown in A that contain OSFs with protuberances or interconnections between adjacent OSFs. Arrows indicate interconnections, while protuberances are indicated by arrowheads. (C) Two SIM images (average intensity projections) of the same cells taken within a 2-min interval (initial image pseducolored magenta, with orange after 2 min). An offset was introduced in order to facilitate viewing of changes in configuration of features. Scale bars: 5 µm.

