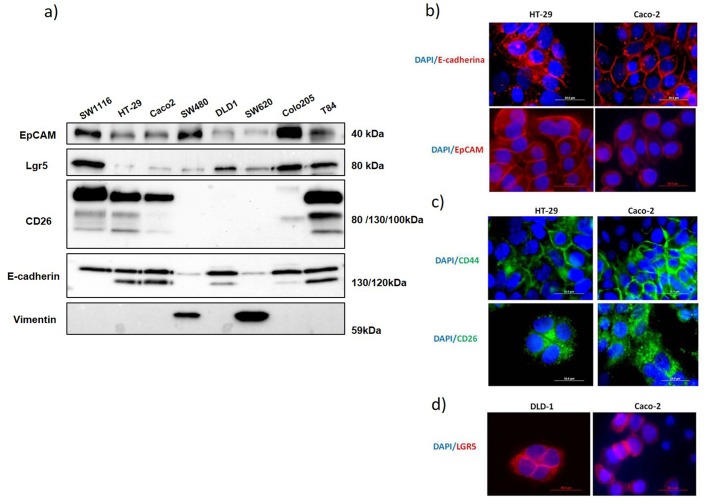
Fig. 1.
Expression of different markers in the eight human colon cancer cell lines analyzed. (A) Western blot analysis of EpCAM, LGR5, CD26, E-cadherin and vimentin expression in total cell extracts from the eight cell lines (20 μg of protein in each line). Data shown are representative of three experiments. (B) E-cadherin and EpCAM expression analysis by immunofluorescence in HT-29 and Caco-2 cells. (C) CD44 and CD26 expression analysis by immunofluorescence in HT-29 and Caco-2 cells. (D) LGR5 expression analysis by immunofluorescence in DLD-1 and Caco-2 cells. Nuclei were stained with DAPI. Scale bars: 50 μm.

