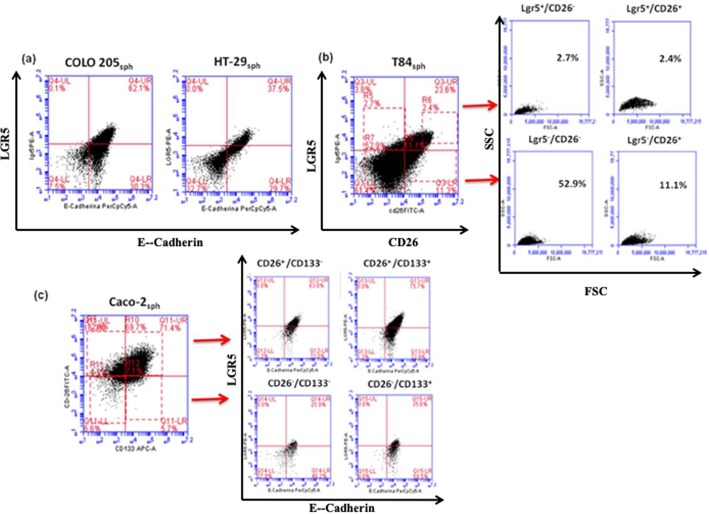
Fig. 3.
Flow cytometry analysis of LGR5/E-cadherin, LGR5/CD26 and CD26/CD133 in sphere-derived cells. (A) Two representative dot plots of LGR5 versus E-cadherin expression in COLO205sph and HT-29sph. (B) LGR5 versus CD26 expression in T84sph. CD26high/LGR5+cells are marked in R6 region in UR quadrant. Physical gatings (FCS versus SSC) of the four quadrants of T84sph are shown. (C) Caco-2sph representative dot plots for CD26 versus CD133 and, on the right, LGR5 versus E-cadherin dot plots of the four regions gated on the left CD26/CD133 dot plot.

