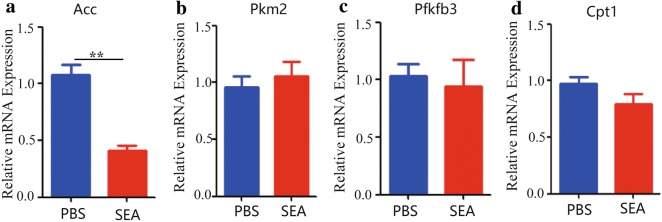
Fig. 5.
Effect of SEA-treated macrophage on the expression of genes related glycolipid metabolism in hepatocytes. a–d RAW264.7 cells were stimulated with SEA (25 μg/ml) for 24 h at 37 °C. Then, unstimulated FL83b cells were seeded in lower chamber of the transwell with 0.4 μm Pore Polycarbonate Membrane Insert and the SEA-activated RAW264.7 cells were added into upper chamber and co-cultured for another 24 h. After that, the FL83b cells were collected in the lower chamber and the expression of metabolic genes using real-time PCR was analyzed. Transcript levels for each gene in livers are expressed as fold change over transcript levels in PBS-treated control cells. Data are expressed as the mean ± SD of three independent experiments with similar results (Student’s t-test: **P < 0.01, ***P < 0.001)

