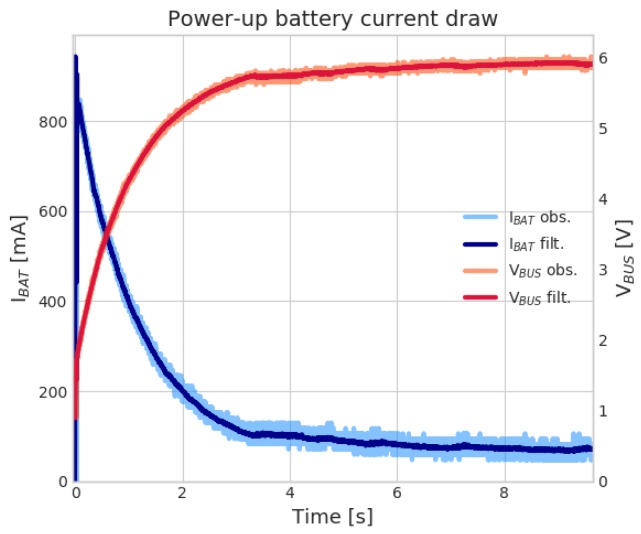
Figure 2.
IoT sensor power-up. A large current peak is observed (blue line, left y-axis), corresponding to the super-capacitors charge current; meanwhile the bus voltage (red line, right y-axis), which is connected to the super-capacitors, ramps-up to the nominal value. After charging, the current then settles around an average of 80 mA, while the sensor scans WiFi networks for joining.

