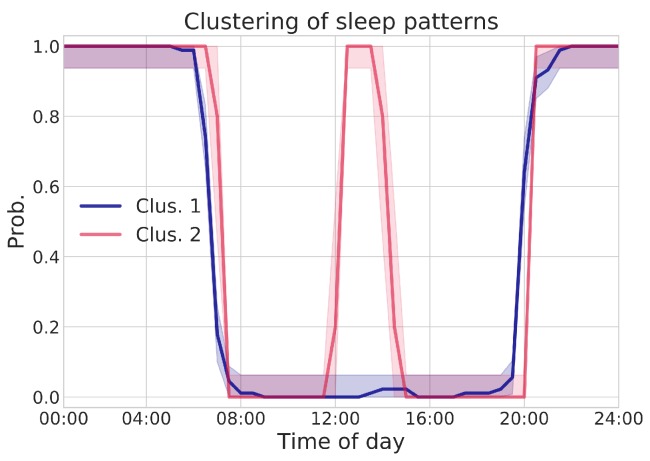
Figure 4.
SP visualizations, resulting from data-driven pattern clustering. Average SP are plotted as solid lines, representing the probability of having the person resting in bed at each point in time for the day. Shaded area, instead, represent the uncertainty, in the form of 95% confidence intervals, in such point-wise probability estimate. The time in x-axis is referred to UTC, whereas the pilot timezone is UTC+1. The deviations between the two pattern clusters, from 12:30 p.m. to 2:00 p.m. (UTC) are found to be statistically significant ().

