
Fig. 6.
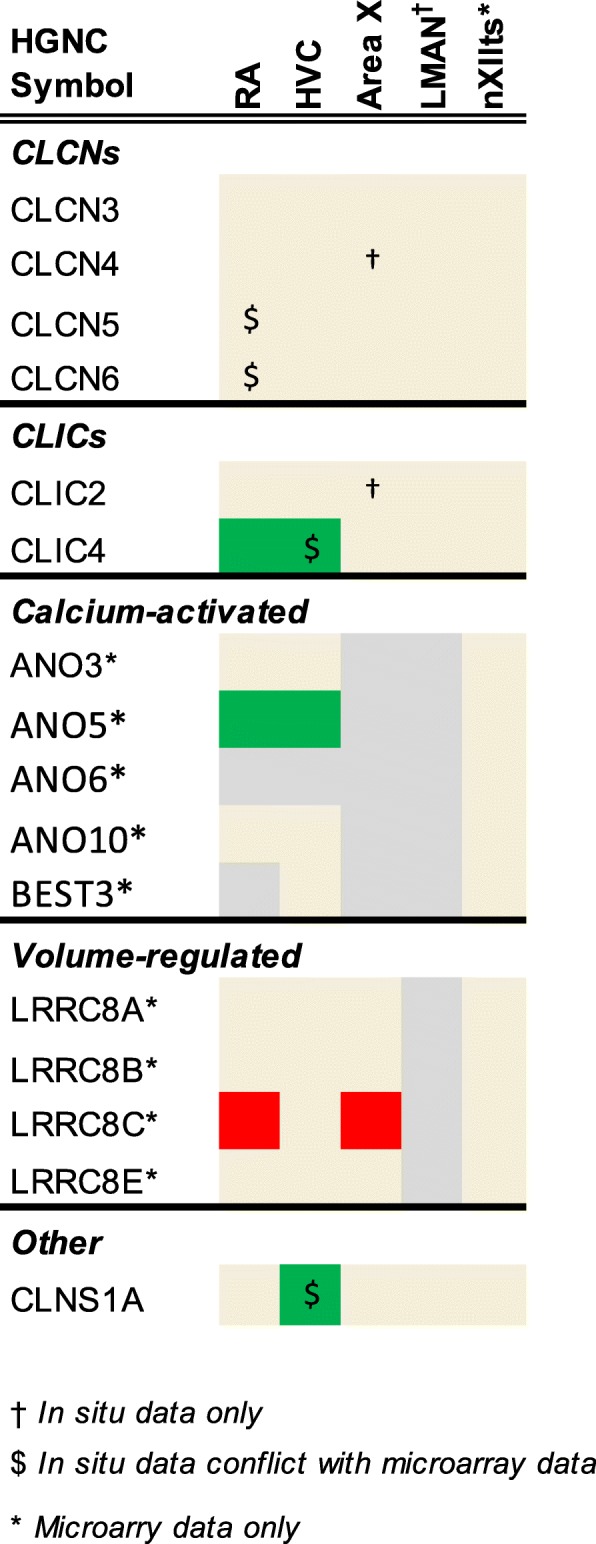
Regulation of chloride channel genes. Color shading indicates a gene that is higher (green), lower (red), or non-differential (shaded tan) in each song nucleus examined compared to the surrounding areas. Genes not assessed in a given nucleus are in grey. Gene expression was assessed by microarray and/or in situ hybridization