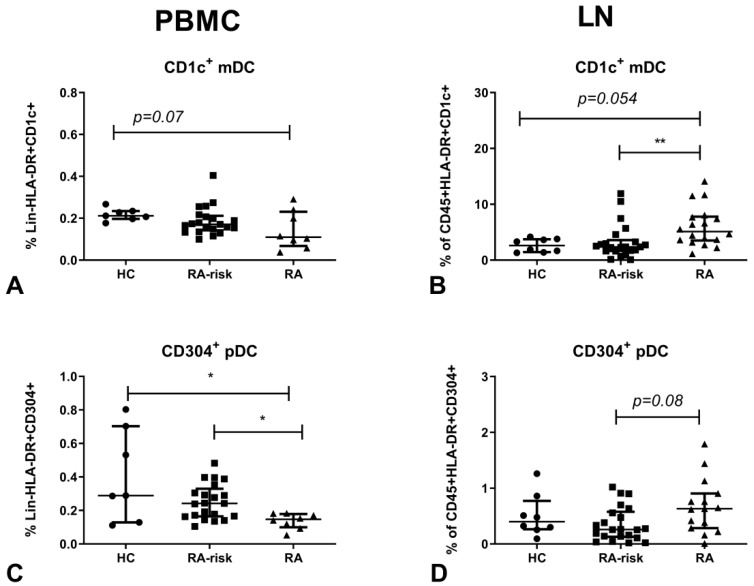
Figure 1.
Myeloid (mDC and plasmacytoid(p)DC frequencies in lymphoid tissue and peripheral blood. Frequencies of mDCs (A,B) and pDCs (C,D) are determined in peripheral blood mononuclear cells (PBMC; A,C) and lymphoid tissue (LN; B,D). For PBMC, the frequencies are plotted as frequencies of the lineage (Lin)-HLA-DR+ population. For lymph nodes (LNs) the frequencies are plotted as frequencies of the CD45+HLA-DR+ population. PBMC: HC (n = 7), RA-risk (n = 21) and RA (n = 8). LN: HC (n = 8), RA-risk (n = 22), RA (n = 15 or 18). Data are presented as median with interquartile range (IQR). For statistical analysis, a Kruskall–Wallis test was performed and significant differences were determined using a post Dunn’s multiple comparisons test and indicated as * p < 0.05 or ** p < 0.01.

