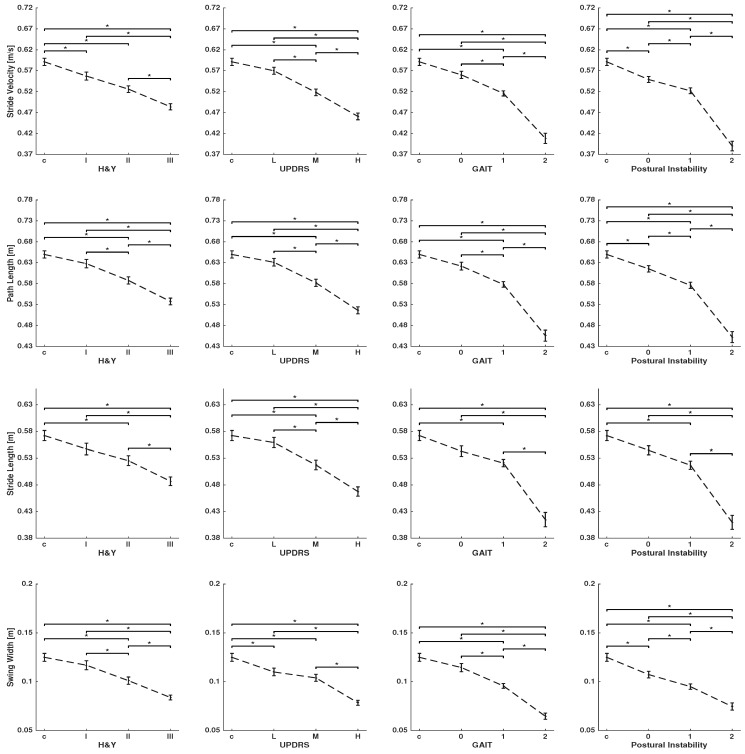
Figure 3.
Per-stride parameters characterizing turning: stride velocity, path length, stride length, and swing width were calculated for controls and PD patients who were grouped according to the H&Y disease stage, UPDRS-III score, and the single items, gait and postural instability, of the UPDRS-III. Group data are displayed as mean ± SEM and were compared using one-way ANOVA, followed by Bonferroni’s post hoc test, where * indicates .

