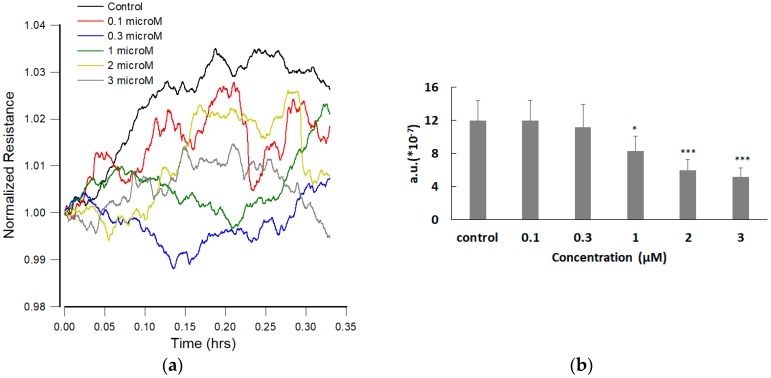
Figure 4.
(a) Normalized resistance data recorded 20 h after the addition of medium containing FCCP or medium alone to a confluent hMSC layer to give the final concentrations of 0.1 μM (red), 0.3 μM (blue), 1 μM (green), 2 μM (yellow), 3 μM (gray), and control (black). Each curve consists of 1200 data points taken at 1-s intervals. Here only the first 1024 data points in each curve were used to calculate Var32 values. (b) Var32 analysis of the normalized resistance data shown in Figure 4a. Dose dependent effect of FCCP on hMSC micromotion is observed. Values shown are mean ± standard error (n = 10 for each concentration of FCCP). * p < 0.05, *** p < 0.001.

