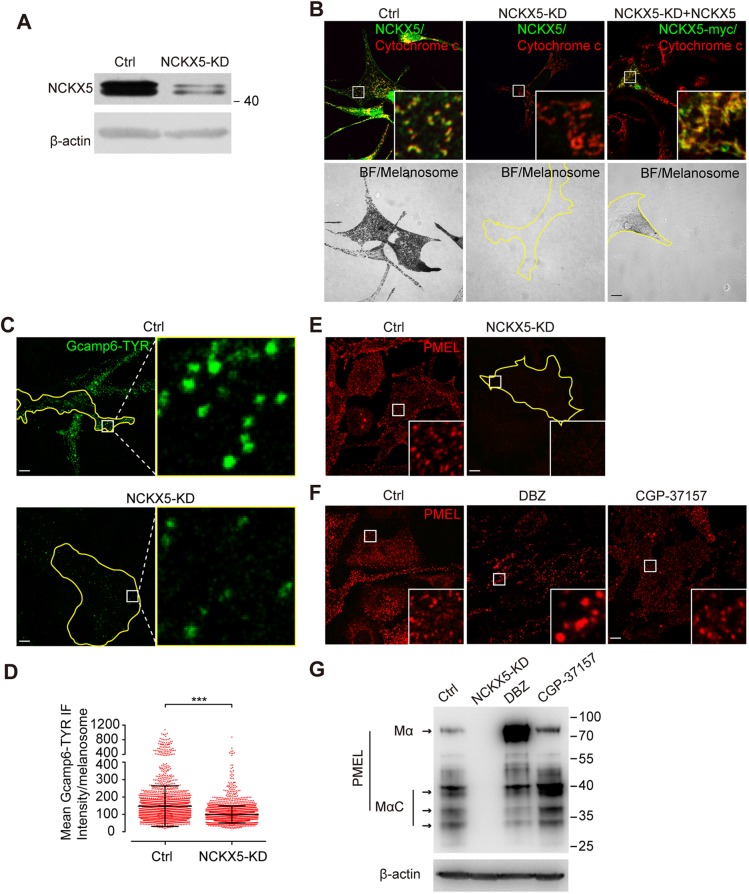
Fig. 2.
Loss of NCKX5 compromises melanosomal Ca2+ concentration, melanosomal protein PMEL expression and melanin production. (A) Western blot analysis of lysates from melan-a melanocytes stably expressing control shRNA (Ctrl) and melan-a melanocytes stably expressing Nckx5 shRNA (NCKX5-KD), using NCKX5 polyclonal anti-sera. β-actin antibody was used as a loading control. (B) Confocal immunofluorescence images of Ctrl melanocytes, NCKX5-KD melanocytes and NCKX5-KD melanocytes transfected with shRNA-resistant NCKX5–Myc by colabeling with NCKX5 polyclonal anti-sera and cytochrome c antibody. BF images of pigmented melanosomes are also presented. Outlines of cells are indicated by yellow lines. Insets show 6× magnified images of the boxed region. (C) Confocal immunofluorescence images of melan-a wild-type melanocytes (WT) and NCKX5-KD melanocytes transfected with GCaMP6–TYR. Outlines of cells are indicated by yellow lines. Insets show 12× magnified images of the boxed region. (D) Quantification of mean fluorescent intensity of GCaMP6–TYR in WT and NCKX5-KD group; n=2336, and 2723 melanosomes, respectively. Each point represents the mean fluorescent intensity of a GCaMP6–TYR-labeled single melanosome. ***P<0.001 (Student's t-test). (E) Confocal immunofluorescence images of melanocytes labeled for melanosomal protein PMEL in Ctrl and NCKX5-KD melanocytes. Insets show 5× magnified images of the boxed region. (F) Confocal immunofluorescence images of melanocytes incubated with the compounds DMSO (Ctrl), DBZ (30 μM) or CGP-37157 (10 μM) stained for the melanosomal protein PMEL. Outlines of cells are indicated by yellow lines. Insets show 5× magnified images of the boxed region. (G) Western blot analysis of lysates of Ctrl melanocytes, NCKX5-KD melanocytes, and melan-a melanocytes incubated with DBZ (30 μM) or CGP-37157 (10 μM) using PMEL antibody. β-actin antibody was used as a loading control. Scale bars: 10 µm.

