Fig. 5.
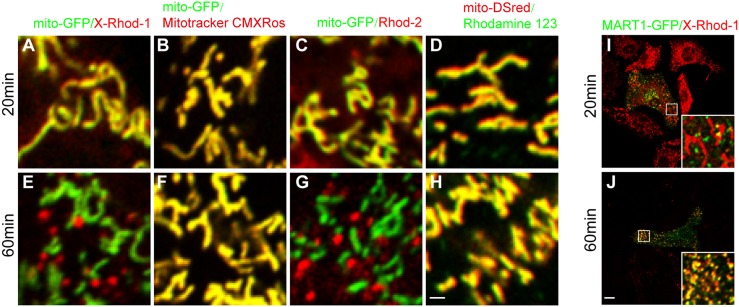
X-Rhod-1 and Rhod-2 specifically efflux from mitochondria and influx into melanosomes. (A–D) Images of melanocytes transfected with mito-GFP and labeled with chemical compound dyes (20 min after washing with medium following dye loading for 30 min): X-Rhod-1 (A); mitotracker CMXRos (B); Rhod-2 (C) and Rhodamine 123 (D). (E–H) Images of melanocytes transfected with mito-GFP and labeled with indicated chemical compound dyes (60 min after washing with medium following dye loading for 30 min): X-Rhod-1 (E); mitotracker CMXRos (F); Rhod-2 (G) and Rhodamine 123 (H). Scale bar: 1 μm. (I) Images of melanocytes transfected with MART1–GFP and labeled with X-Rhod-1 at 20 min after washing with medium following dye loading for 30 min. (J) Images of melanocytes transfected with MART1–GFP and labeled with X-Rhod-1 at 60 min after washing with medium following dye loading for 30 min. Scale bar: 10 μm.

