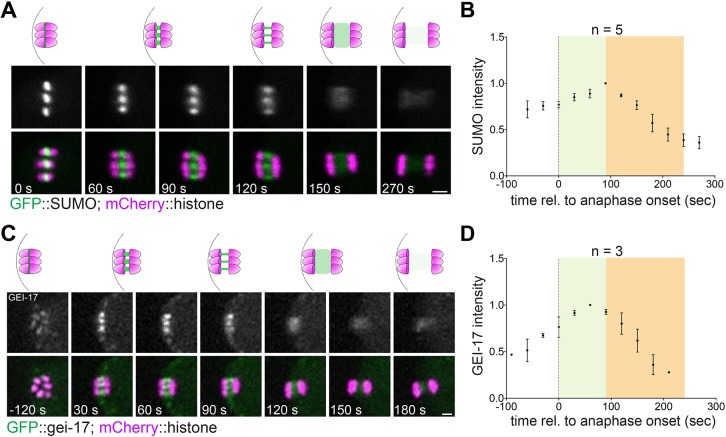
Fig. 1.
SUMO dynamics during anaphase I. (A) SUMO localisation throughout meiosis I was followed in live oocytes from a strain expressing GFP::SUMO. A single z-slice is shown in the images. (B) Quantification of the SUMO signal from images as in A. The graph displays the mean±s.e.m. (n=5). (C) The localisation of the SUMO E3 ligase GEI-17 was followed throughout meiosis I in oocytes expressing GFP::GEI-17. (D) Quantification of the GFP::GEI-17 intensity from images as in C. The graph displays the mean±s.e.m. (n=3). Scale bars: 2 µm.

