Fig. 2.
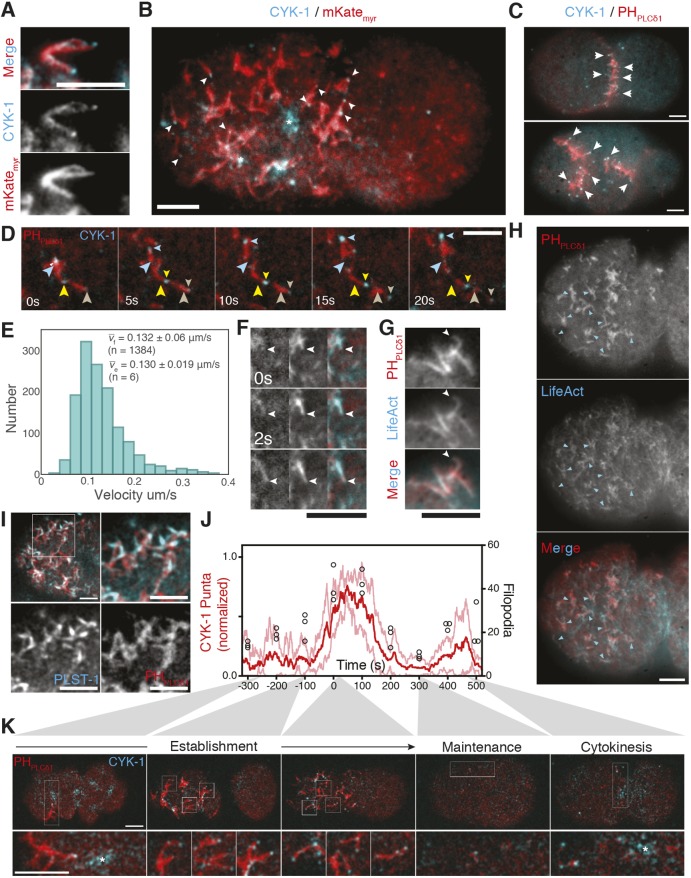
Asymmetric cortical structures resemble filopodia. (A) Magnified region from the pseudocleavage furrow in embryo expressing mKatemyr and CYK-1::GFP. See Movie 2. (B) CYK-1 localization to large contractile foci (*), and tips of filopodia-like structures revealed by mKatemyr (arrowheads) in embryo anterior. (C) Surface images of two- and four-cell embryos expressing CYK-1::GFP and mCherry::PHPLCδ1. Arrowheads mark CYK-1-tipped membrane structures at cell contacts. (D) Time course of filopodia movement. Large arrowheads denote CYK-1::GFP puncta at time=0 s. Position in subsequent frames marked by small arrowheads of corresponding color. See Movie 3. (E) Histogram of CYK-1::GFP puncta velocities. vf denotes mean±s.d. velocity for all CYK-1 puncta. ve is the mean of embryo means. (F) Growth time course of a single filopodium (arrowhead) from embryo shown in H highlighting LifeAct localization throughout the extending structure (mCherry::PHPLCδ1, left; LifeAct::GFP, middle; merge, right). See Movie 4. (G) Example of LifeAct::GFP labeling throughout extended mCherry::PHPLCδ1-positive filopodia (arrowhead). Labeling observed in 13/13 extended filopodia (three embryos). (H) Extensive colocalization of LifeAct::GFP with mCherry::PHPLCδ1 within putative filopodia (arrowheads) (n=4). (I) Cortical image of embryo anterior showing mCherry::PHPLCδ1 and PLST-1::GFP (top left). The boxed area is magnified (top right) with individual channels shown below. Quantification and additional images are in Fig. S3A,B. (J) Number of CYK-1 puncta (normalized to peak number; mean in red with ±s.d. in pink) and PHPLCδ1-labeled structures (black circles) over time. Time 0 s is the transition between establishment and maintenance phase marked by relaxation of the pseudocleavage furrow. Cytokinesis occurs at between 400 and 500 s. (K) Confocal cortical images of embyro expressing CYK-1::GFP and mCherry::PHPLCδ1 at representative time points. Boxed areas are shown magnified 3× below. The asterisk indicates large pulsatile foci common at polarity establishment and cytokinesis. See Movie 5. Colocalization of CYK-1 puncta with mCherry::PHPLCδ1-labeled structures in Fig. S3A. Scale bars: 5 µm.

