Fig. 3.
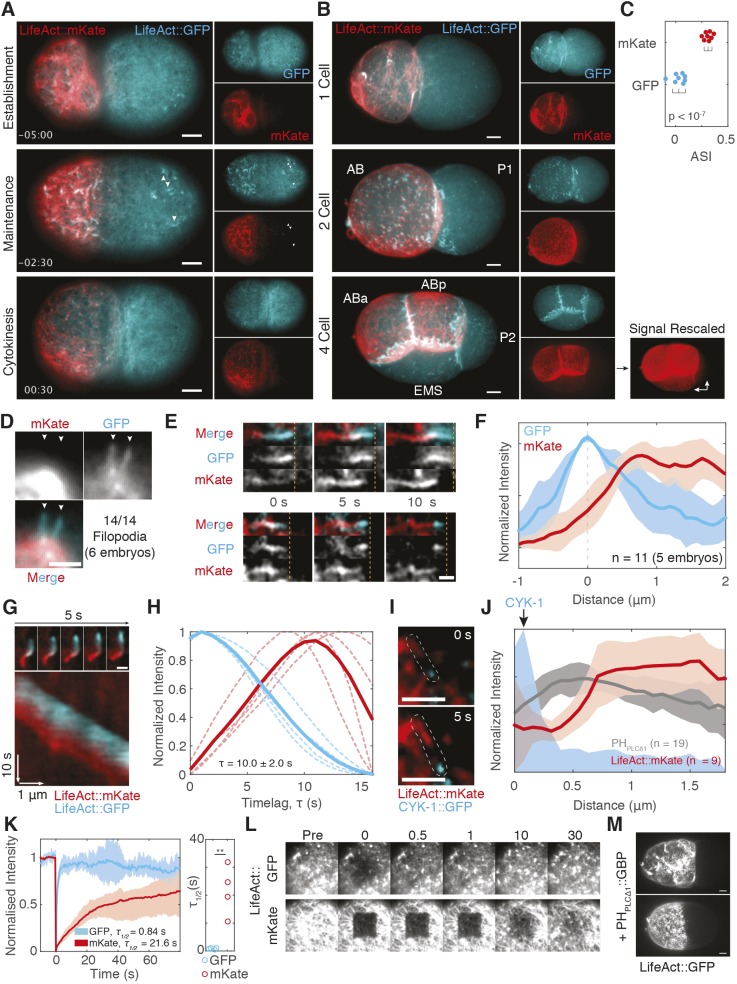
LifeAct::GFP and LifeAct::mKate label distinct actin populations in vivo. (A) Cortical images of LifeAct::mKate vs LifeAct::GFP during the first cell cycle, quantified in (C). Arrowheads mark posterior filopodial structures that are only labeled by LifeAct::GFP. Time (min:sec) relative to cytokinesis. (B) Max 3D projections of 1-, 2- and 4-cell embryos. LifeAct::mKate signal in the 4-cell embryo is shown rescaled to highlight asymmetry between EMS and P2 (arrows). (C) Asymmetry (ASI) of LifeAct::GFP vs LifeAct::mKate signal in 1-cell establishment phase embryos (panel A). (D) LifeAct::GFP, but not LifeAct::mKate, labels filopodia extending from the cell surface. (E) LifeAct::mKate lags LifeAct::GFP labeling of two processive surface-associated filopodia. Computationally straightened images shown. Dashed lines mark leading edge of GFP signal for reference. See Movie 6. (F) Lag of LifeAct::mKate relative to peak LifeAct::GFP signal in fluorescence intensity traces along filopodia. (G) Time lapse images of a cytoplasmic actin comet labeled with LifeAct::mKate and LifeAct::GFP and an associated kymograph taken along a trace of the comet path. See Movie 7. (H) Quantification of LifeAct::mKate time lag measured from kymographs as in G. Average temporal change across a minimum of ten positions for each individual comet (dashed lines, n=4) shown along with mean of embryo means (solid lines). Δτ is the peak-to-peak time lag. (I) Time lapse of images of a filopodium (outlined) labeled by CYK-1::GFP and LifeAct::mKate. (J) Quantification of LifeAct::mKate or mCherry::PHPLCδ1 relative to GFP::CYK-1 puncta. Mean±s.d. shown. (K) FRAP analysis of cortical LifeAct::GFP versus LifeAct::mKate following bleaching of a 6.2×6.2 µm box. Mean FRAP trace (±max/min; shaded area) (left) shown along with τ1/2 for each replicate. **P<0.01 (two-tailed t-test). (L) Time series of FRAP experiments from K. (M) Stabilization of LifeAct::GFP by membrane-tethered GFP nanobody (PHPLCδ1::GBP)-induced segregation. Maximum z-projections at establishment (top) and maintenance phase (bottom) are shown (n=3). Scale bars: 5 µm (A,B,D,M), 2.5 µm (E,G,I).

