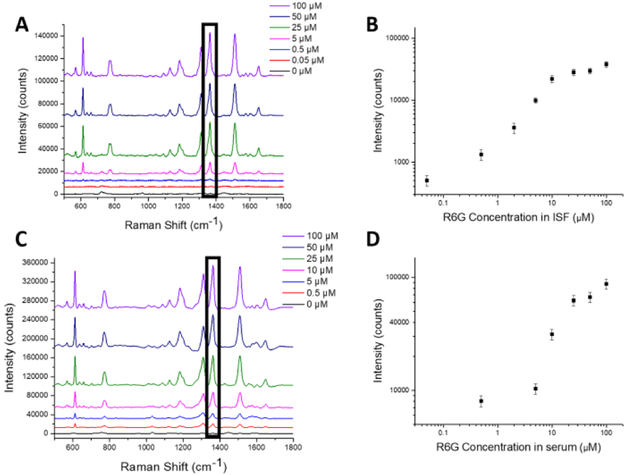
Figure 4.
Measurement of R6G in plasmonic paper by SERS. Representative SERS spectra obtained from plasmonic paper soaked in different concentrations of R6G in (A) ISF and (C) serum. The Raman spectra show an increase in characteristic Raman peaks for R6G at 610, 1364 and 1512 cm−1 with increase in concentration. The Raman band at 1364 cm−1 (indicated with a black rectangular box) was used to generate calibration curves for R6G concentration in (B) ISF and (D) serum. Data points show mean ± standard deviation from 6 spectra collected from each plasmonic paper substrate.

