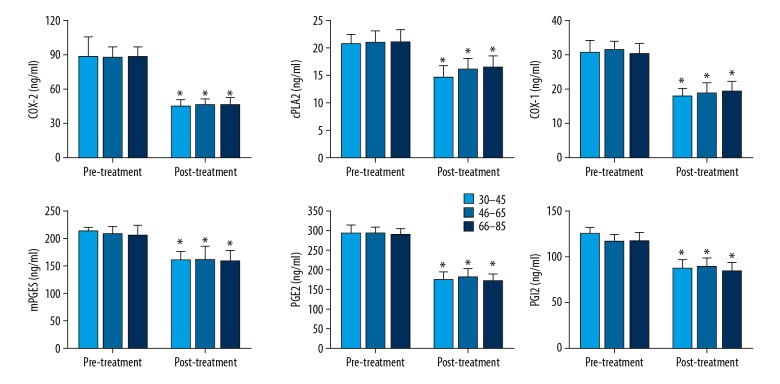
Figure 5.
Expression of COX-2, cPLA2, COX-1, mPGES, PGE2, and PGI2 before and after treatment in serum of lung cancer patients in different age groups. The data are presented by mean ±SD (standard deviation). * Indicates a statistically significant difference is found between the before and after treatment comparison (p<0.05).

