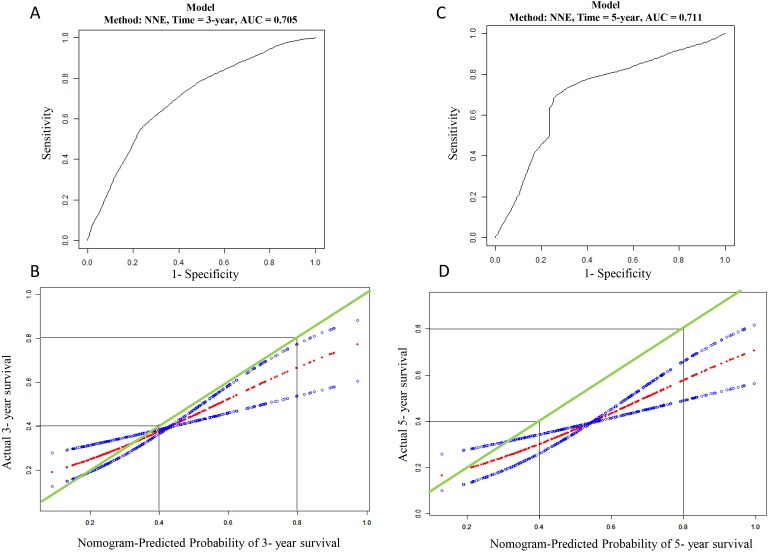
Figure 5. Evaluation of mRNA prediction model.
(A) ROC curve based on the mRNA risk score for 3-year overall survival probability in TCGA cohort. (B) The calibration plots for predicting patient 3-year overall survival. Green line indicates actual survival in TCGA cohort; dotted red and blue indicate nomogram-predicted probability of survival and its corresponding 95% confidence interval, respectively. (C) ROC curve based on the mRNA risk score for 5-year in TCGA cohort; (D) the calibration plots for predicting patient 5-year overall survival in TCGA cohort. Green line indicates actual survival in TCGA cohort; dotted red and blue indicate nomogram-predicted probability of survival and its corresponding 95% confidence interval, respectively.

