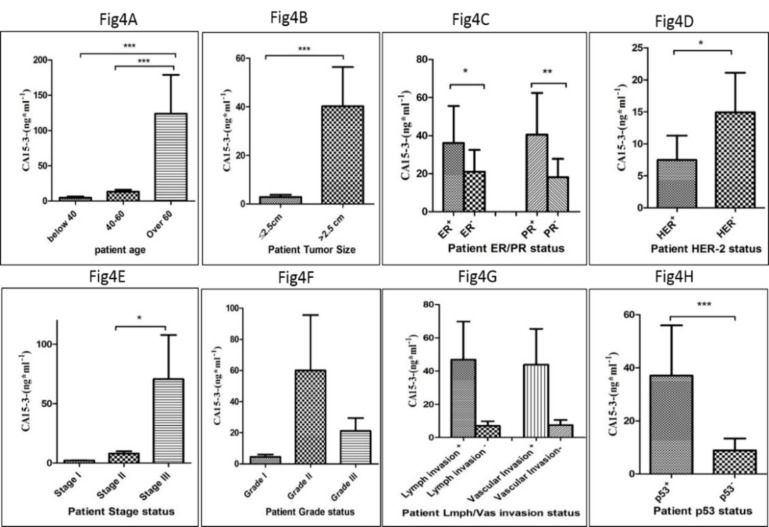
Figure 4.
The correlation of the level of CA15-3 with patients’ clinicopathological features is shown according to the patient age distribution (A), tumor size (B), ER and PR statues (C), Her2 status (D), P53 status (E), grade of cancer (F), stages of cancer (G) and lymph/vascular invasion (H) (*= P <0.05, **= P <0.01, ***= P <0.001)

