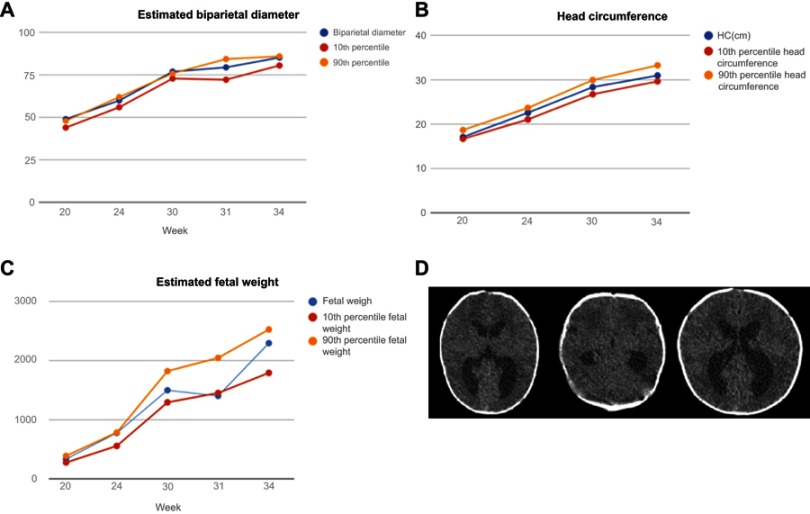
Figure 3.
The different estimated measurements (estimated biparietal diameter, head circumference, estimated fetal weight) based on fetal ultrasonography records in five different measurements (20th, 24th, 30th, 31st and 34th week of gestation) Y-axis. Coaxial tomography scan (CT-scan) at 1 week after birth. Images correspond to the second case that involved hydrocephalus and clinical ventriculomegaly. (A) Representation of the different measurements of the biparietal diameter expressed in millimeters (mm) X-axis in a scatter plot. (B) Modeling the increase in head circumference expressed in centimeters (cm) X-axis at different time points by scatter plot. (C) Estimation of the fetal weight expressed in grams (G) X-axis at different points during gestation. The blue line represents different estimations (biparietal diameter, head circumference and fetal weight), the red line represents the 10th percentile in each parameter and the orange line represents the 90th percentile in each parameter (D). Post-natal ventriculomegaly demonstrated by coaxial tomography scan; the red arrows indicate the measurement of the lateral ventricular horn (measurement:16.2 mm) and the green arrows indicate asymmetric compensatory ventricular enlargement.

