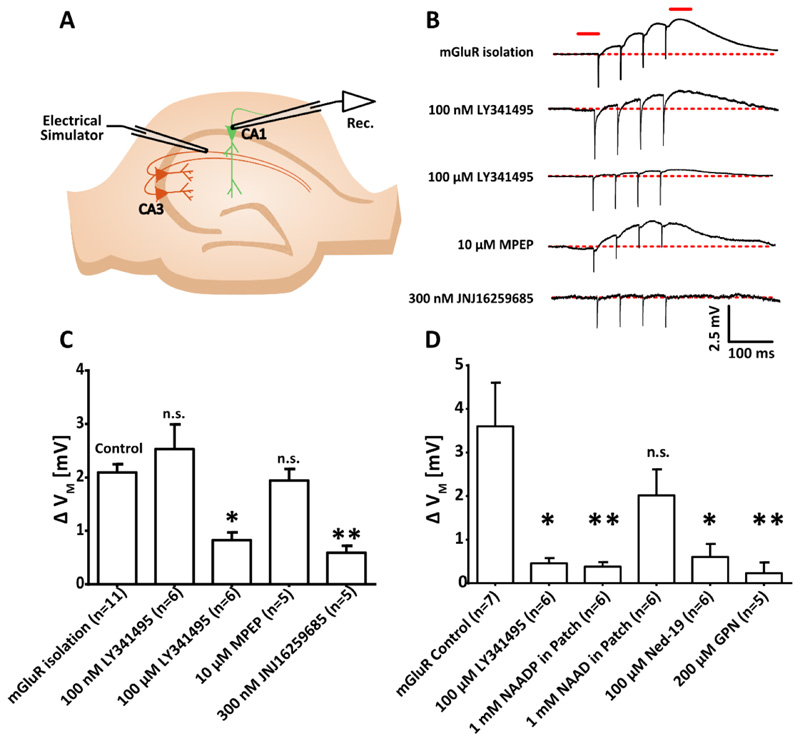
Figure 3. Activation of mGluR1 in CA1 pyramidal neurons causes a membrane depolarization that depends on NAADP signalling and acidic store Ca2+ signalling.
(A) Diagram showing the experimental configuration to record membrane potential of CA1 pyramidal neurons in hippocampal slices whilst mGluRs were pharmacologically isolated (50 μM AP5, 10 μM NBQX, 100 μM picrotoxin, and 2 μM CGP 55845) and electrical stimulation was applied to Schaffer collaterals (4 pulses, 20 Hz), (n=11 cells). (B) Typical voltage recordings from single cells upon electrical stimulation with pharmacological isolation of mGluRs or plus antagonism of group 2 and 3 mGluRs (LY341485 at 100 nM; n=6), panmGluRs (LY341485 at 100 μM; n=6), mGluR5 (MPEP, 10 μM; n=5) or mGluR1 (JNJ16259685, 300 nM; n=5) (top to bottom). The red lines indicate where membrane potentials were compared before and after stimulation. (C and D) Transient membrane depolarization (ΔVM) of CA1 pyramidal neurons after electrical stimulation alone (control; n=7 cells) or with the presence of (C) the mGluR antagonism described in (B), or (D) pan-mGluR antagonist [LY341485, 100 μM; n=6; cells and data set are independent from those in (C)], desensitizing concentration of NAADP inside the internal solution of the patch pipette (1 mM; n=6), NAAD inside the internal solution of the patch pipette (1 mM; n=6), preincubation with the NAADP antagonist Ned-19 (100 μM, 40 min; n=6), or acute administration of the lysosomal disrupting agent GPN (200 μM; n=5). Data are mean ± SEM; n = single cells. ** P < 0.01 and * P < 0.05 by Kruskal-Wallis and post hoc Dunn’s tests.

