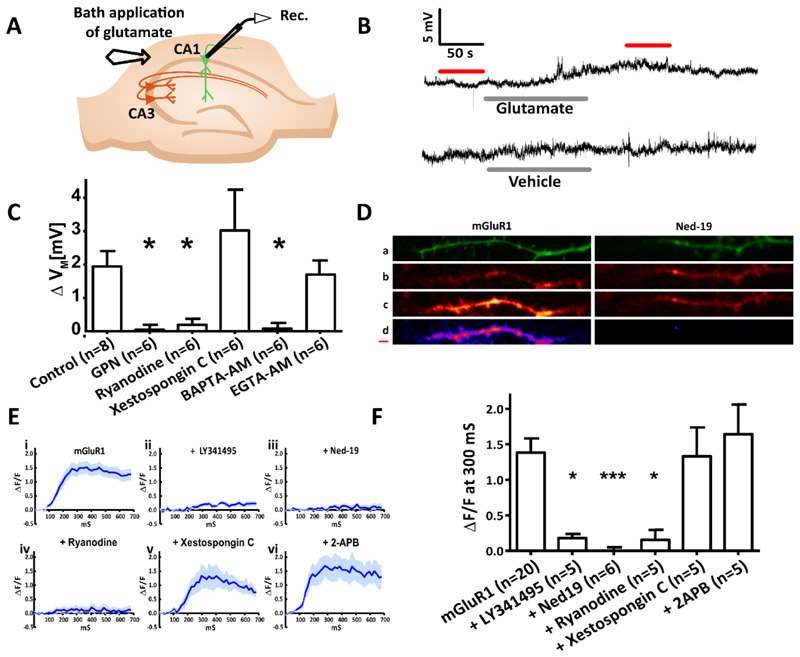
Figure 4. In CA1 pyramidal neurons, mGluR1-dependent membrane depolarization and Ca2+ release require acidic store signalling and Ca2+ release from the ER via ryanodine receptors but not IP3 receptors.
(A) Diagram showing the experimental configuration. The membrane potential of CA1 pyramidal neurons in hippocampal slices was recorded whilst mGluR1 was pharmacologically isolated and extracellular glutamate was applied. (B) Typical voltage recordings recorded upon bath application of glutamate (300 μM, 120 s) or the vehicle. (C) Columns show mean ΔVM of CA1 pyramidal neurons before and after extracellular glutamate application under control conditions (n=8) and in the presence of the lysosomal disrupting agent GPN (200 μM; n=6), ryanodine receptor antagonist ryanodine (40 μM, 15 min; n=6), IP3 receptor antagonist Xestospongin C (2 μM, 15 min; n=6), ‘fast’ Ca2+ chelator BAPTA (20 μM, 15 min; n=6), or the ‘slow’ Ca2+ chelator EGTA (20 μM, 15 min; n=6). (D) Time series images of CA1 neurons filled with Ca2+ indicator OGB-1 (1 mM) were recorded whilst mGluR1 was pharmacologically isolated (50 μM AP5, 10 μM NBQX, 100 μM picrotoxin, and 2 μM CGP 55845) and electrical stimulation was applied (4 pulses, 20 Hz). Images top to bottom: z-stack of the dendritic branch being imaged (green); Ca2+ signal at baseline, before stimulation; Ca2+ signal 300 ms after stimulation; subtraction of Ca2+ at 300 ms from baseline (purple). Scale bar, 0.5 μm. (E) ΔF/F over the imaging time course where mGluR1 was pharmacologically isolated (n=20 cells) in combination with acute application of LY341495 (100 μM, 10 min; n=5), pre-incubation with Ned-19 (100 μM, 1 hour; n=6), or acute application of ryanodine (20 μM, 10 min; n=5), xestospongin C (2 μM, 15 min; n=5), or 2-APB (50 μM, 15 min; n=5). (F) Columns show mean ΔF/F before and after electrical stimulation for each pharmacological manipulation undertaken. Significance was assessed with Kruskal-Wallis and post hoc Dunn’s tests; Error bars denote SEM, n = single cell. Significant differences indicated by asterisks where *** = P < 0.005 ** = P < 0.01 and * = P < 0.05.

