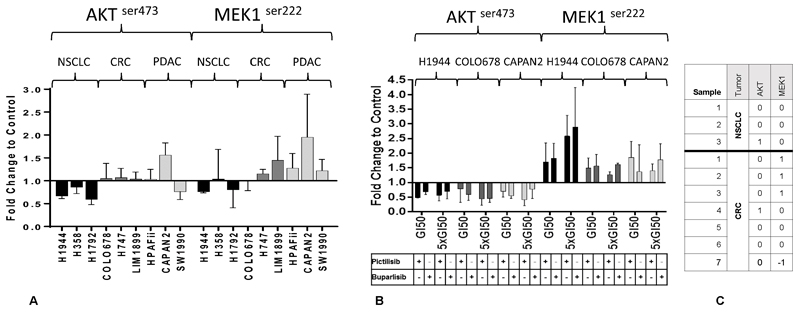
Figure 4.
Validation of findings in phosphoproteomic screen
A) Changes in phosphorylation caused by the pan-PI3K inhibitor, pictilisib. Nine cell lines were exposed to pictilisib in 3 separate experiments and the phosphorylation of p-MEK and p-AKT was measured to confirm findings in the initial screen. B) Changes in phosphorylation caused by equitoxic concentrations of PI3K inhibitors pictilisib and buparlisib for 1 hr at GI50 and x 5 GI50 concentration for 1 hr. The phosphoprotein changes caused by both inhibitors are concordant. C) Changes in phosphorylation in 10 samples of cancer cells isolated from patients with KRASMT cancers exposed to pictilisib. 1, -1 indicate changes more than 2 standard deviations above or below control, respectively and 0 indicates changes between 2 standard deviations above or below the control. None of the NSCLC samples showed a significant increase in p-MEK while 3/7 CRC samples did. Significant reductions in p-AKT levels were not seen in NSCLC or CRC samples. The concentrations of drugs used for the cell lines are detailed in the Supplementary Data. The patient-derived cell lines were exposed to a concentration of pictilisib of 96.3 nM.
The histograms in A and B represent means and the error bars represent standard deviation.

