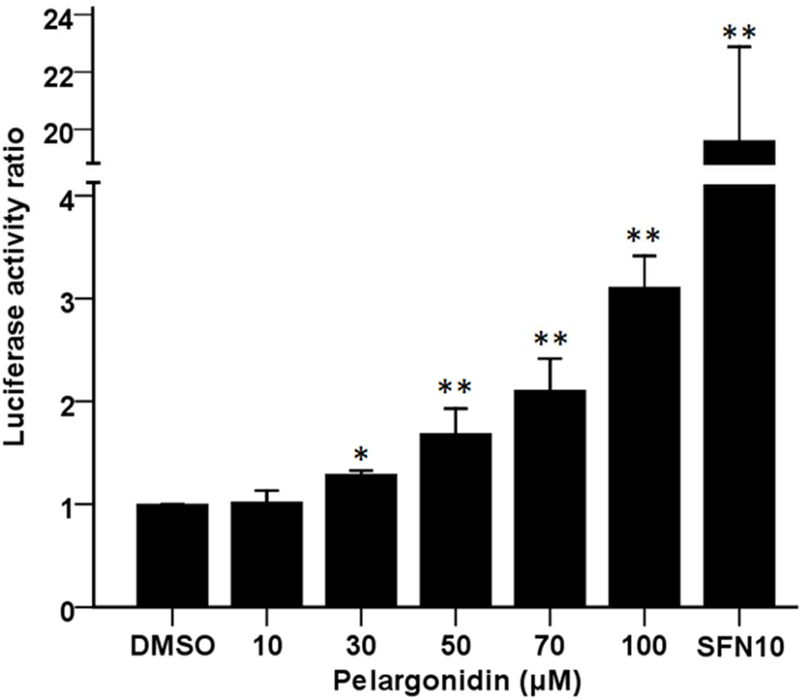
Fig. 4.
Increase in ARE-luciferase expression in response to pelargonidin in HepG2-C8 cells. Luciferase expression was calculated based on the protein concentrations in each group. The statistical data are presented as the mean ± SD of three independent treatments in HepG2-C8 cells. *, P< 0.05 and **, P< 0.01, compared to the control group.

