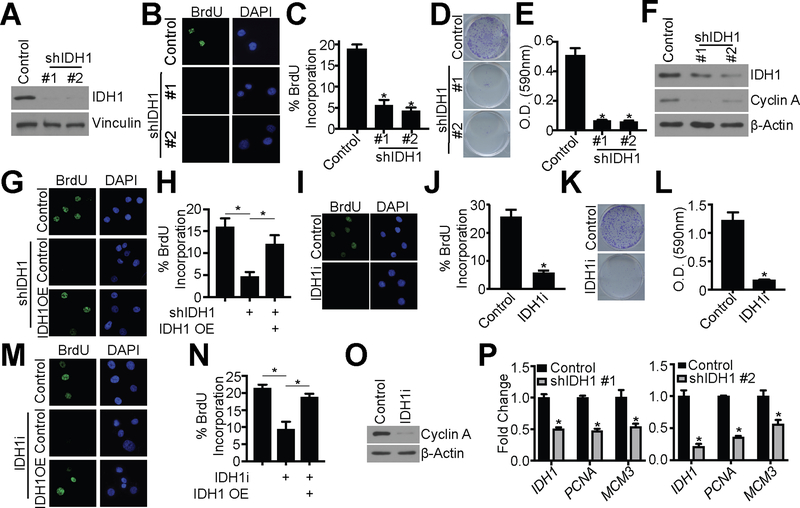
Figure 3: Knockdown or pharmacological inhibition of IDH1 suppresses proliferation of HGSC cells.
(A-F) Ovcar3 cells were infected with lentivirus expressing two independent short hairpin RNAs (shRNAs) targeting IDH1 (shIDH1). Empty vector was used as a control.
(A) Immunoblot analysis of IDH1. Vinculin was used as a loading control. One of 5 experiments is shown.
(B) BrdU incorporation. One of three experiments is shown.
(C) Quantification of (B). Data represent mean ± SD. *p<0.0001
(D) Colony formation. One of three experiments is shown.
(E) Quantification of (D). Data represent mean ± SD. *p<0.0001
(F) Immunoblot analysis of IDH1 and cyclin A. β-Actin was used as a loading control. One of three experiments is shown.
(G-H) Ovcar3 cells were infected with lentivirus expressing a short hairpin RNA targeting IDH1 (shIDH1) with or without ectopic overexpression of IDH1 cDNA (IDH1 OE). Empty vector was used as a control. Cells were selected with puromycin for 7 days
(G) BrdU incorporation. One of three experiments shown.
(H) Quantification of (G). Data represent mean ± SD. *p<0.005
(I-L) Ovcar3 cells were treated with either DMSO or 15 μM GSK864 (IDH1i) for 7 days.
(I) BrdU incorporation. One of three experiments shown.
(J) Quantification of (I). Data represent mean ± SD. *p<0.0001
(K) Colony formation. One of three experiments is shown.
(L) Quantification of (K). Data represent mean ± SD. *p<0.0001
(M-N) Ovcar3 cells were treated with 15 μM GSK864 (IDH1i) with or without ectopic overexpression of IDH1 cDNA (IDH1 OE). Cells were collected after 7 days.
(M) BrdU incorporation. One of three experiments shown.
(N) Quantification of (M). Data represent mean ± SD. *p<0.02.
(O) Immunoblot of Ovcar3 cells cultured in ULA conditions and treated with 15 μM GSK864 (IDH1i) for cyclin A. β-Actin was used as a loading control. One of three experiments shown.
(P) RT-qPCR analysis of IDH1, PCNA, and MCM3 of Ovcar3 shIDH1 cells cultured in ULA conditions. B2M was used as a reference gene. RNA was collected four days after infection. One of three experiments is shown. Data represent mean ± SD. *p<0.02

