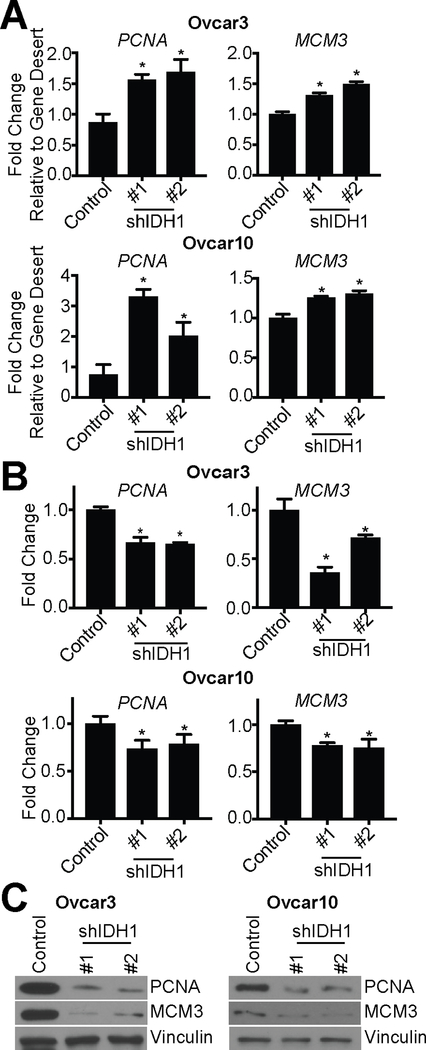
Figure 5: Knockdown of IDH1 increases repressive H3K9me2 at E2F gene target loci.
Ovcar3 and Ovcar10 cells were infected with two independent hairpins targeting IDH1. Empty vector was used as a control.
(A) H3K9me2 ChIP was performed, and H3K9me2 binding to PCNA and MCM3 was determined by qPCR and is normalized to a gene desert region control. One of two experiments is shown. Data represent mean ± SD. *p<0.02
(B) RT-qPCR analysis PCNA and MCM3 expression. B2M was used as a reference gene. One of three experiments is shown. Data represent mean ± SD. *p<0.008
(C) Immunoblot analysis of PCNA and MCM3. Vinculin was used as a loading control. One of two experiments is shown.

