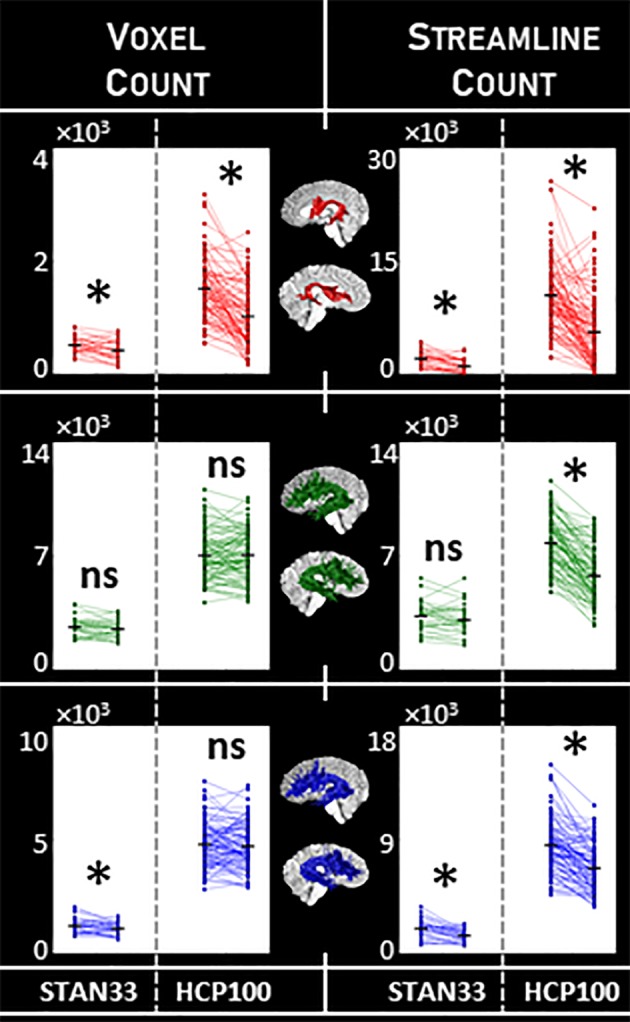
Figure 2.

Macrostructure laterality for the arcuate. We measured arcuate macrostructure using voxel count and streamline count (columns) for the three tractography classes DET, PROB, and ePROB (red, green, and blue, respectively). We tested for laterality using paired‐sample one‐tailed t tests; comparisons marked with * indicate p < α = .05, Bonferroni‐corrected, while nonsignificant comparisons are marked “ns.” We compare the two independent datasets STAN33 and HCP100, and identify the most consistency with DET. Measurements provided in Table 1. (Compare to Figure 4, and see also Figures A7 and A10) [Color figure can be viewed at http://wileyonlinelibrary.com]
