
Figure 5.
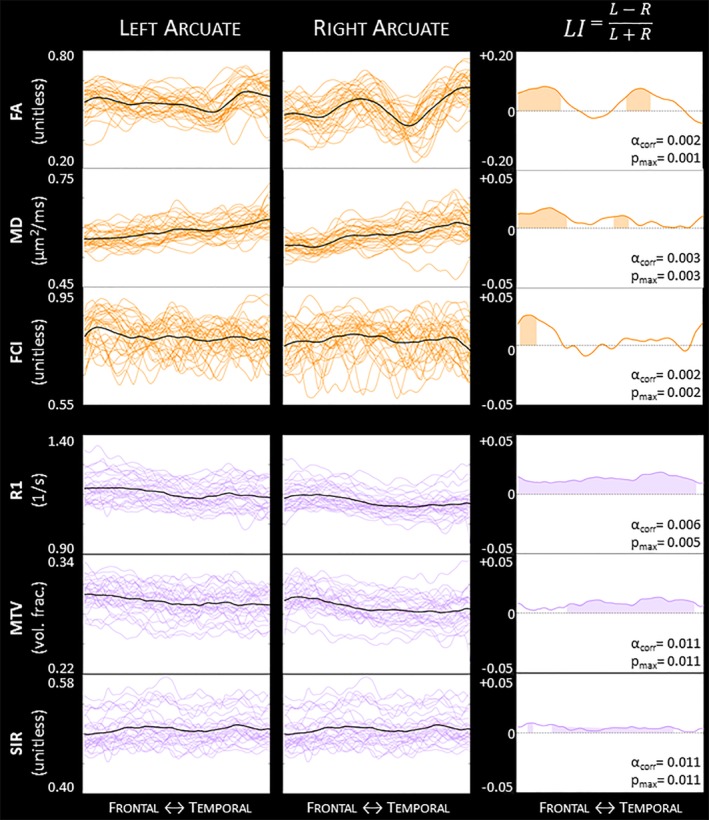
DET arcuate individual tract profiles and LI profiles for the STAN33 dataset. We illustrate microstructure laterality for the diffusion measurements FA, MD, and FCI (orange) and the quantitative nondiffusion measurements R1, MTV, and SIR (purple). Individual tract profiles for subjects' left and right arcuate are displayed in the thin colored lines, while the group mean is displayed with a thick black line. The right column shows the group LI profiles, whereby a positive LI score indicates a leftward asymmetry and a negative LI score indicates a rightward laterality. (Note the different y axis for the first LI profile.) The shaded areas denote segments along the profile that display statistically significant asymmetry, as calculated with a permutation test; α corr is the new alpha value after correcting initial α = .05; and p max is the largest p‐value within the shaded area. See also Figures A20–A24. FA = fractional anisotropy; FCI = Fiber Coherence Index; MD = mean diffusivity; MTV = macromolecular tissue volume; SIR = surface interaction rate [Color figure can be viewed at http://wileyonlinelibrary.com]