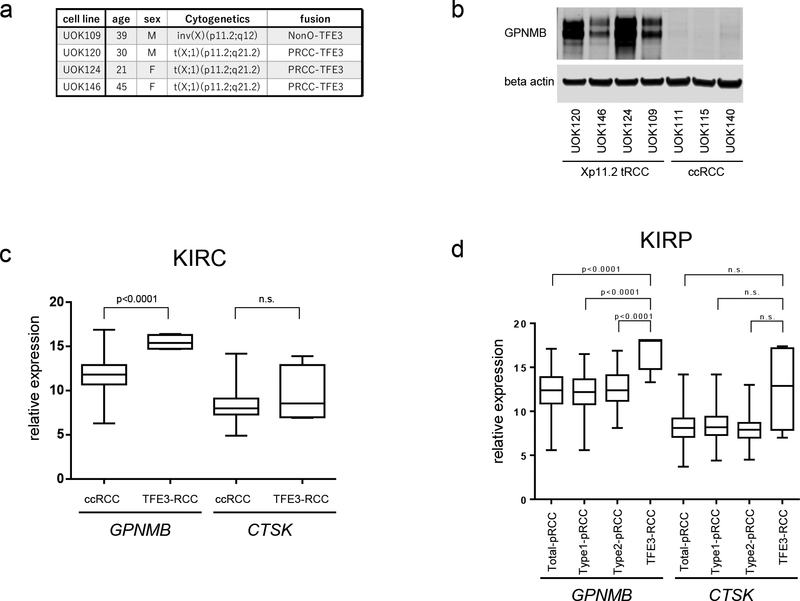
Figure 4. GPNMB overexpression differentiates TFE3-RCC from clear cell RCC and papillary RCC.
(a,) Detailed information of four TFE3-RCC cell lines. (b) Western blotting demonstrates significantly higher GPNMB expression in TFE3-RCC cell lines compared to ccRCC cell lines. (c) Comparison of GPNMB and Cathepsin K (CTSK) expression in TFE3-RCC (n=4) and ccRCC (n=465). The gene expression database for ccRCC (KIRC) from the Cancer Genome Atlas project which contained 4 cases of TFE3-RCC was utilized for analysis. (d) The gene expression database for papillary RCC (KIRP) from the Cancer Genome Atlas containing 6 cases of TFE3-RCC was utilized to compare GPNMB and Cathepsin K (CTSK) expression in TFE3-RCC and papillary RCC. Total papillary RCC (n=283 without TFE3-RCC) includes 161 cases of type1 papillary RCC and 79 cases of type2 papillary RCC. Data are represented as a box-and-whisker plot. (unpaired t-test with or without Welch’s correction, based on p-value of the F test: n.s. not significant)

