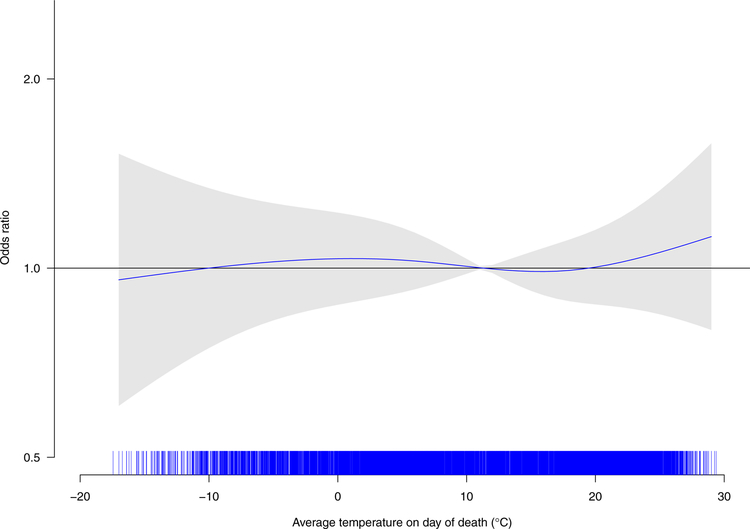
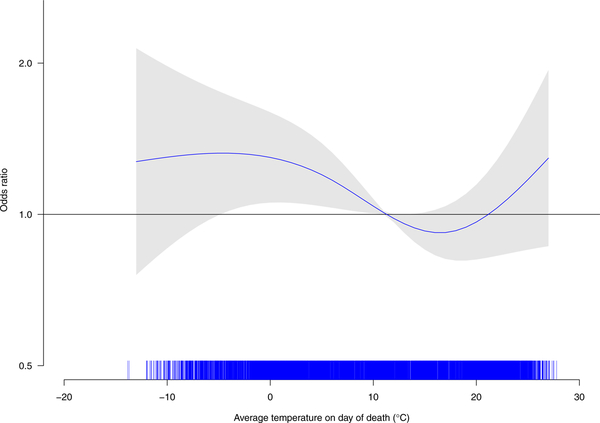
Figure 1.
Non-linear association of average temperature on the day of death (Panel A) and over the seven days (Panel B) prior to death with odds of opioid-involved overdose death in Connecticut and Rhode Island, January 2014 – June 2017 (n = 3,275)
Panel A
Panel B
Note: Case and referent periods were matched on year, month, and day of week and the association was adjusted for relative humidity and federal holidays.


