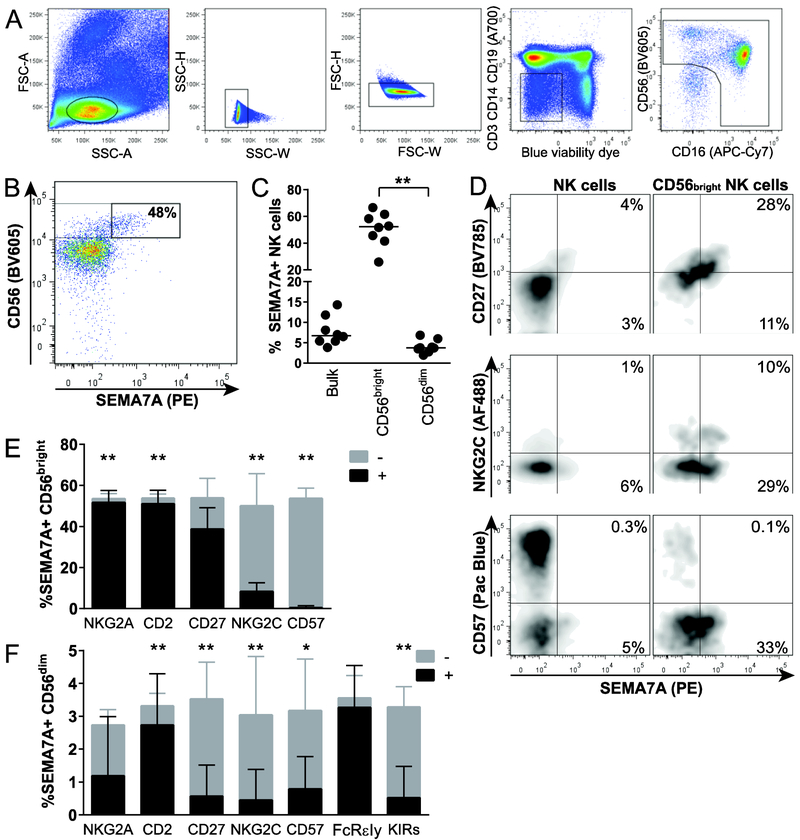
Figure 1. Differential expression of SEMA7A on distinct human NK cell subsets.
(A) Representative flow cytometry gating strategy to analyze NK cells. PBMC were first gated on forward angle light scatter (FSC-A) and side light scatter (SSC-A) to define lymphocytes and then on SSC-height and SSC-W gating followed by FSC-height and FSC-W to eliminate doublets. Dead cells were excluded by using LIVE/DEAD™ Fixable Blue Dead Cell Stain kit, and CD3, CD14 and CD19 staining were used to exclude T cells, monocytes and B cells, respectively. CD56 and CD16 were used to identify NK cells within the CD14−CD19−CD3− population. (B) Representative flow cytometry plot depicting SEMA7A expression on unstimulated NK cells from one healthy donor, with gating on CD56bright NK cell subset. (C) Each data point represents proportions of SEMA7Apos NK cells in bulk, CD56bright and CD56dim peripheral blood NK cells for each of 8 healthy donors. Bar indicates the median. Asterisks indicate significant differences between NK cell subpopulations. ** p<0.01. (D) Representative flow cytometry pots depicting co-expression of SEMA7A and CD27 (top), NKG2C (middle) and CD57 (bottom) on bulk (left) and CD56bright (right) NK cells. (E) and (F) Stacked bar charts represent mean + SEM percentages of all SEMA7Apos CD56bright (E) and SEMA7Apos CD56dim (F) NK cells expressing (black portion of the bar) or not expressing (grey portion of the bar) the indicated markers. Asterisks represents significant differences in proportions of SEMA7A+ NK cells expressing or not indicated markers. * p<0.05; ** p<0.01. Data are shown for n=8 donors and pooled from 2 independent experiments. Significance determined by Wilcoxon matched-pairs signed rank test.

