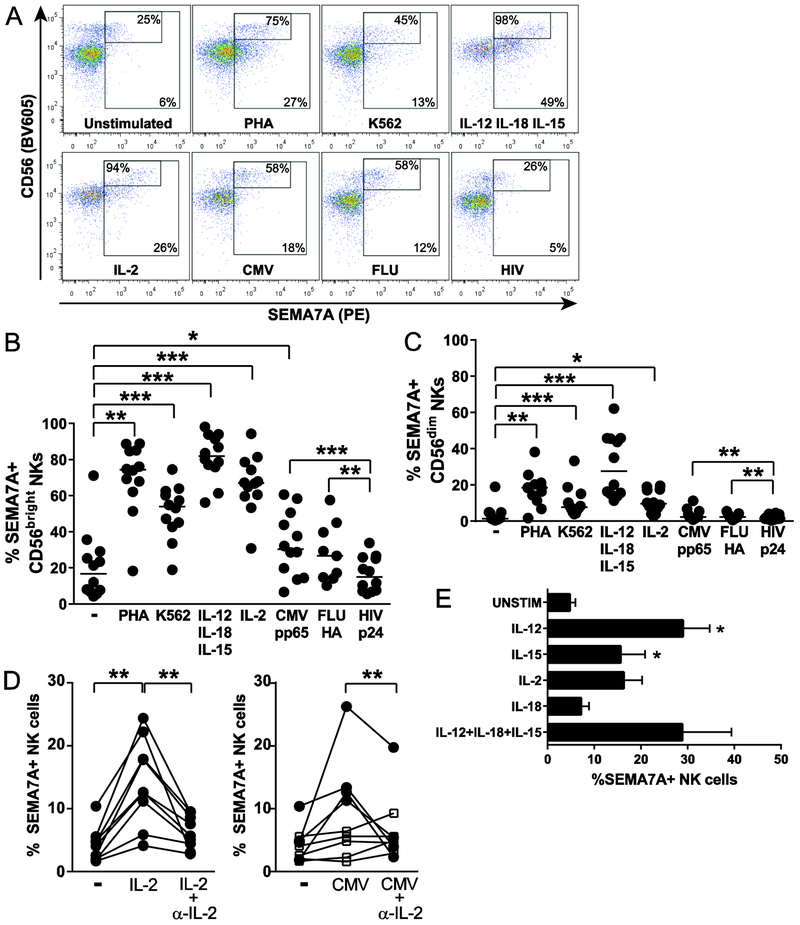
Figure 2. Up-regulation of SEMA7A on activated NK cells.
(A) Representative flow cytometry plots depicting SEMA7A expression on NK cells left unstimulated or co-cultured overnight with the indicated stimuli, with gating on all NK cells and on the CD56bright NK cell subset. Stimuli tested included 2 μg/mL viral antigens, 100 U/mL IL-2, 20 ng/mL IL-12 + 10 ng/mL IL-18 + 1 ng/mL IL-15, 5 μg/mL PHA and HLA-deficient K562 cells at 10:1 E:T ratio. (B) and (C) Each data point represents proportions of SEMA7Apos CD56bright (B) or SEMA7Apos CD56dim (C) NK cells from 12 healthy donors co-cultured with indicated stimuli as described above. Bar indicates the median. Data are shown for n=12 donors and pooled from 4 independent experiments. (D) Proportions of SEMA7Apos bulk NK cells following co-culture with 20 U/mL IL-2 or 2 μg/mL CMV pp65 with or without 10 μg/mL anti-IL-2 blocking Ab. Filled circles represent subjects with increased SEMA7A expression on NK cells upon stimulation with IL-2 or CMV. Open squares represent subjects with no SEMA7A response to CMV. Data are shown for n=9 donors and pooled from 3 independent experiments. Statistics were applied on values represented by filled circles. (E) Bar graphs represent mean + SEM percentages of SEMA7Apos NK cells following overnight incubation with individual cytokines including 20 ng/mL IL-12, 1 ng/mL IL-15, 100 U/mL IL-2, 10 ng/mL IL-18 or a combination of 20 ng/mL IL-12 + 10 ng/mL IL-18 + 1 ng/mL IL-15 for 6 healthy donors except for IL-2 (n=4) and for IL-12+IL-18+IL-15 (n=2). Asterisks indicate significant differences in SEMA7A expression. Data are shown for n=6 donors and pooled from 2 independent experiments. * p<0.05, ** p<0.01, and *** p<0.001 determined by Wilcoxon matched-pairs signed rank test.

