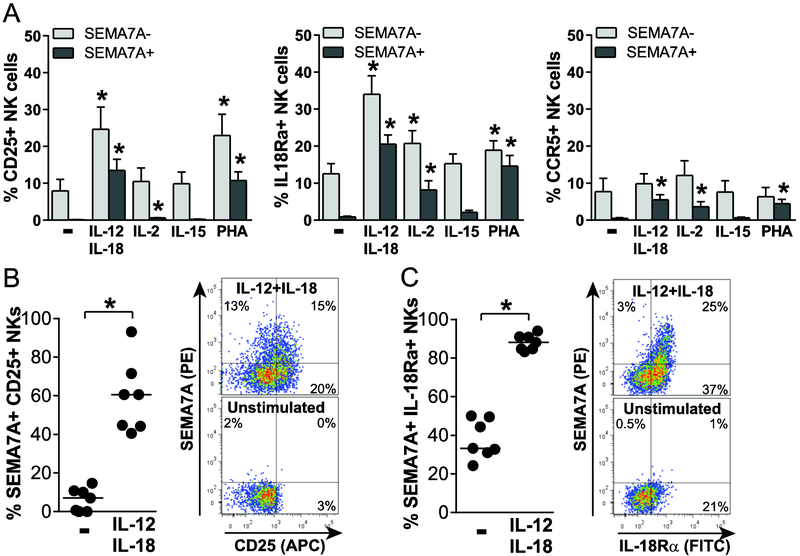
Figure 3. SEMA7Apos NK cells express innate cytokine and chemokine receptors.
(A) Percentages of CD25pos (left), IL-18Rαpos (middle) or CCR5pos (right) NK cells that do not (light grey bars) or do (dark grey bars) express SEMA7A after overnight culture in the absence or presence of indicated stimuli, including 50 ng/mL IL-12 + 100 ng/mL IL-18, 100 U/mL IL-2, 1 ng/mL IL-15 and 5 μg/mL PHA, were determined by flow cytometry for 7 healthy donors. Bar graphs represent mean + SEM. Asterisks indicate significant differences in proportions of SEMA7Aneg or SEMA7Apos NK cells expressing each marker after stimulation with indicated stimuli compared to unstimulated. (B) and (C) Dot plots (left panel) and representative flow cytometry plot (right panel) depicting proportions of SEMA7Apos CD25pos (B) or SEMA7Apos IL-18Rαpos (C) NK cells after overnight culture in medium alone or supplemented with 50 ng/mL IL-12 + 100 ng/mL IL-18. Data are shown for n=7 donors and pooled from 2 independent experiments. * p<0.05.

