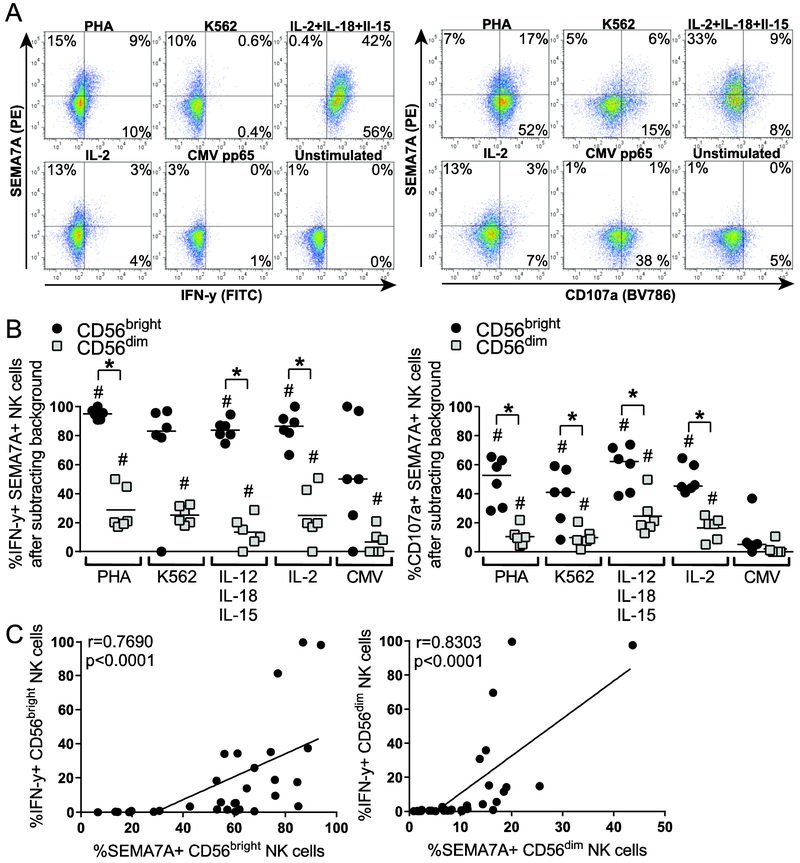
Figure 4. SEMA7A expression is associated with IFN-γ production by NK cells.
(A) Representative flow cytometry plots depicting co-expression of SEMA7A and IFN-γ (left) or CD107a (right) on bulk NK cells after overnight culture of PBMCs in medium alone or in the presence of 5 μg/mL PHA, K562 cells at 10:1 E:T ratio, 20 ng/mL IL-12 + 10 ng/mL IL18 + 1 ng/mL IL15, 100 U/mL IL-2, or 2.8 μg/mL CMV pp65 native protein. (B) Each data point represents proportions of IFN-γpos (left panel) or CD107apos (right panel) SEMA7Apos CD56bright (black circles) and CD56dim (grey squares) NK cells following overnight incubation with indicated stimuli after subtracting background (unstimulated). Bar indicates the median. Asterisks indicate significant differences in proportions of IFN-γpos NK cells that are positive for SEMA7A between CD56bright and CD56dim NK cells. * p<0.05. Pound signs indicate differences in IFN-γ production upon stimulation compared to unstimulated. ## p<0.01. Significance determined by Wilcoxon matched-pairs signed rank test. Data are shown for n=6 donors and pooled from 2 independent experiments. (C) Spearman correlation of frequencies of SEMA7Apos and IFN-γpos CD56bright (left panel) or CD56dim (right panel) activated NK cells.

