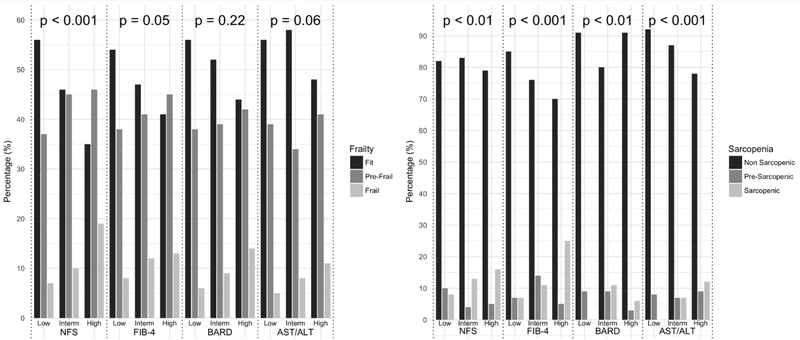
Figure 1. Distribution of liver fibrosis scores’ risk classes across categories of frailty and sarcopenia.
(p values are for chi-squared test; post-hoc chi-squared comparison with Bonferroni correction was performed to verify the statistical significance of the reduced prevalence of sarcopenia in BARD high compared to intermediate risk class: p=0.48)

