Fig. 3.
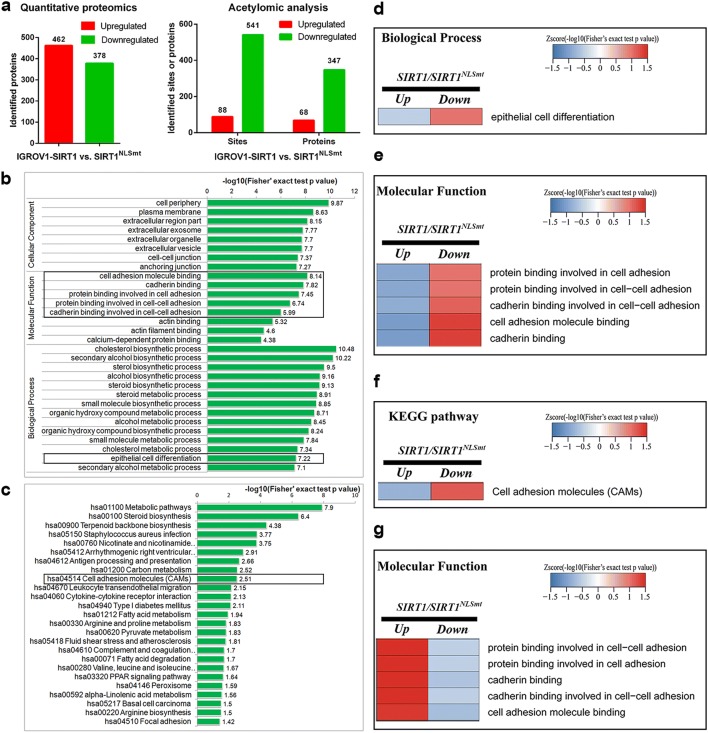
Comparative analysis of the proteome and lysine acetylome in the SIRT1 and SIRT1NLSmt cells. a The upregulated and downregulated proteins and acetylated sites in SIRT1 cells compared with those in SIRT1NLSmt cells via quantitative proteomic (left) and acetylomic (right) analyses. b Enrichment analysis of the downregulated GO classifications from the proteomic analysis in SIRT1 cells compared with those in SIRT1NLSmt cells. c Enrichment analysis of the downregulated KEGG pathways from the proteomic analysis in SIRT1 cells compared with those in SIRT1NLSmt cells. d–g Cluster analyses of enriched proteins according to the GO terms and KEGG pathways of proteome and lysine acetylome. Heat maps show the changes in expression levels of epithelial cell differentiation-associated proteins in the GO biological process category (d), cell adhesion-associated proteins in the GO molecular function category (e) and cell adhesion molecules-associated proteins in KEGG pathways (f) from the proteomic analysis, and the changes in acetylation levels of cell adhesion-associated proteins from the acetylomic analysis (g)

