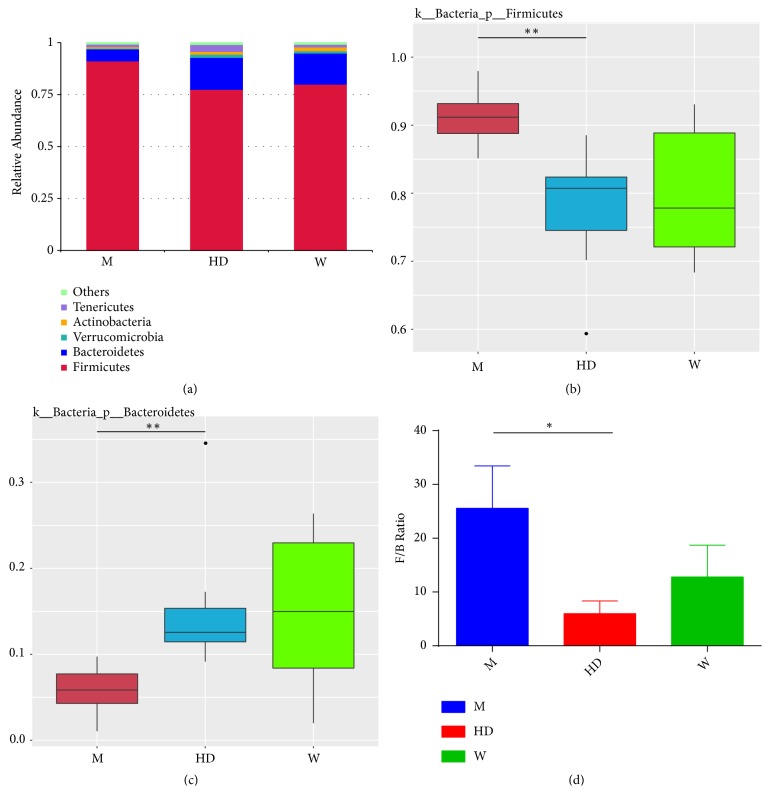
Figure 3.
Changes of flora at the level of phylum. (a) The top 5 phylum of three groups. ((b) and (c)) Box plot of difference among three groups of Firmicutes and Bacteroidetes. The p value was obtained by the permutation test between groups and the p value was corrected by the Benjamini and Hochberg False Discovery Rate (FDR) method to obtain the q value, ∗∗ q<0.01. (d) The ratio of Firmicutes to Bacteroidetes (F/B) in three groups. Results were compared by one-way ANOVA, ∗ P<0.05.

