
Figure 8.
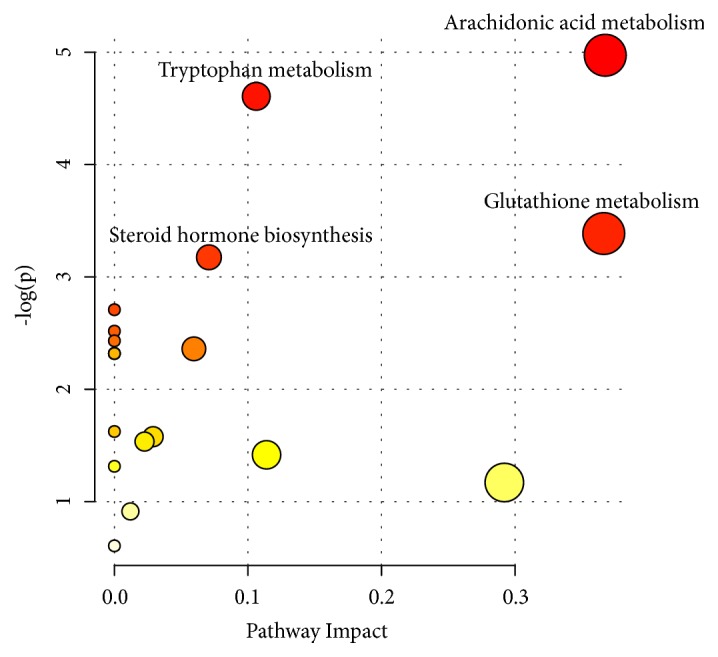
Metabolic pathway analysis of potential biomarkers. The color and size of circles were based on P value and pathway impact value, respectively. The larger the circle, the larger the impact factor; the darker the color, the smaller the P value, and the more significant the enrichment.