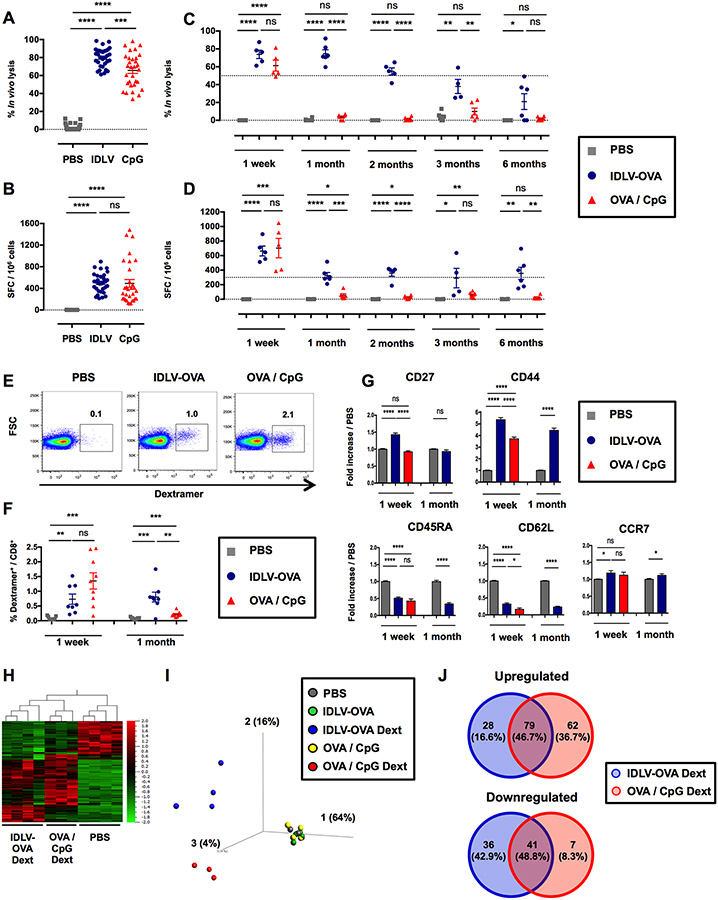
Figure 1. IDLV-OVA induces sustained and persistent CTL responses.
C57BL/6 mice were injected i.v. with PBS, 106 TUs IDLV-OVA or OVA/CpG. (A-B) Seven days later, anti-OVA CTL responses were assessed by an in vivo killing assay (A) and IFN-γ ELISPOT (B). (C-D) The persistence of the anti-OVA CTL responses was assessed by an in vivo killing assay (C) and IFN-γ ELISPOT (D) up to 6 months after immunization. (A-D) The results are expressed as the percentage of specific lysis for the in vivo killing assay (A, C) and IFN-γ spot-forming cells (SFC) per 106 splenocytes for ELISPOT (B, D). Each dot represents an individual mouse. The results represent the means ± SEM of cumulative data from 33 mice from eleven independent experiments (A, B) or from 6 mice from two independent experiments (C, D). (E-G) Seven days and one month later, the OVA-specific CD8+ T cell response was analyzed by H-2Kb/SIINFEKL-Dextramer staining. The gating strategy for CD3+ CD8+ CD4− dextramer positive cells 1 week after immunization is shown in (E). (F) The percentage of CD3+ CD8+ dextramer+ cells among the total CD8+ cells is shown at 1 week and 1 month after immunization. The results represent the means ± SEM of cumulative data from 8 to 9 mice from three independent experiments. (G) Expression of CD27, CD44, CD45RA, CD62L and CCR7 by CD3+ CD8+ dextramer+ cells. The results are expressed as the fold-increase in the mean fluorescence intensity (MFI) ± SEM compared to PBS-injected mice and represent the cumulative data from 8 to 9 mice from three independent experiments. Statistical analysis was performed by unpaired Student’s t-test (ns p > 0.05, * p < 0.05, ** p < 0.01, *** p < 0.001, **** p < 0.0001). (H, I, J) Seven days later, splenic CD8+ T cells were purified from PBS, IDLV-OVA and OVA/CpG treated mice, whereas OVA-specific CD8+ T cells (H-2Kb/SIINFEKL-Dextramer+ CD8+) were purified from IDLV-OVA and OVA/CpG immunized mice. RNA was extracted, and the expression of genes involved in the immune response was assessed with the nCounter Mouse Pan Cancer Immune Profiling Panel. (H) Heat Map of genes significantly and differentially expressed by OVA-specific CD8+ T cells purified from IDLV-OVA or OVA/CpG immunized mice (IDLV-OVA Dext and OVA/CpG Dext, respectively) compared to CD8+ T cells purified from PBS-injected mice (PBS). (I) PCA (Principal Component Analysis) of genes significantly and differentially expressed by OVA-specific CD8+ T cells purified from IDLV-OVA or OVA/CpG immunized mice (IDLV-OVA Dext and OVA/CpG Dext, respectively) compared to CD8+ T cells purified from mice injected with PBS (PBS) or IDLV-OVA (IDLV-OVA) or OVA/CpG (OVA/CpG). (J) Venn diagrams of upregulated (left panel) and downregulated (right panel) genes differentially expressed by IDLV-OVA Dext or OVA/CpG Dext. The results represent the cumulative data from 4 to 5 mice from five independent experiments. See also Figures S1 and S2.

