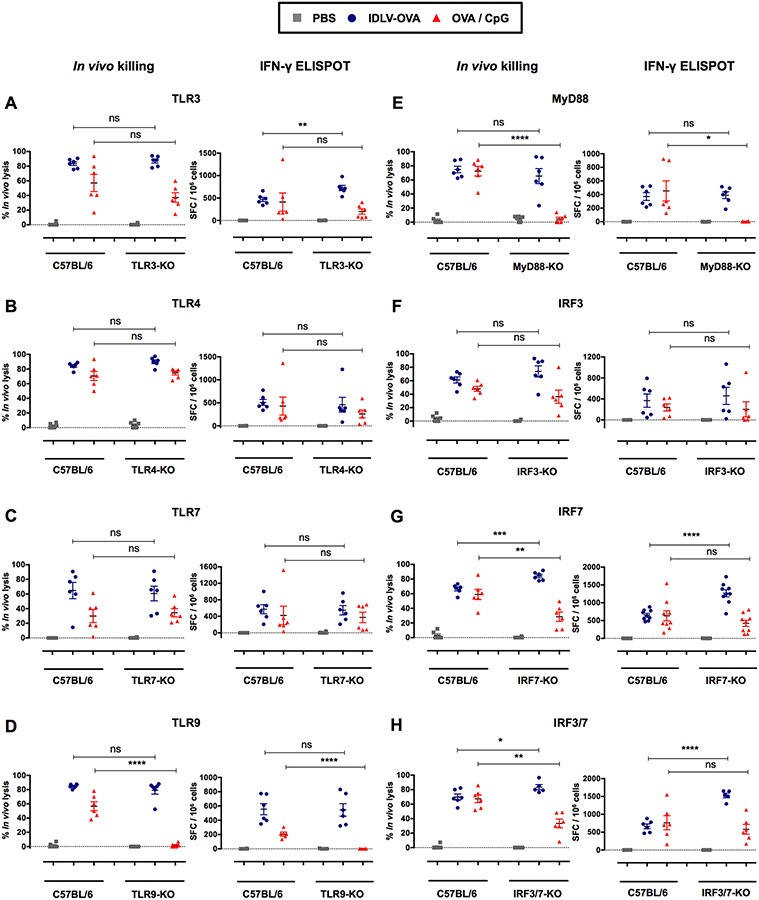
Figure 5. The induction of CTL responses by IDLV-OVA is independent of the TLR3, 4, 7, 9, MyD88, IRF3, and IRF7 pathways.
C57BL/6, TLR3−/− (A), TLR4−/− (B), TLR7−/− (C), TLR9−/− (D), MyD88−/− (E), IRF3−/− (F), IRF7−/− (G) and IRF3/7−/− (H) mice were immunized i.v. with PBS, 106 TUs IDLV-OVA or OVA/CpG. Seven days later, anti-OVA CTL responses were assessed by in vivo killing assays (left panels) and IFN-γ ELISPOT assays (right panels). The results are expressed as the percentage of specific lysis for the in vivo killing assay and as the IFN-γ SFC per 106 splenocytes for ELISPOT. Each dot represents an individual mouse. The results represent the means ± SEM of cumulative data from 5 to 9 mice from two to three independent experiments. Statistical analysis was performed by an unpaired Student’s t-test in comparison with control C57BL/6 mice (ns p > 0.05, * p < 0.05, ** p < 0.01, *** p < 0.001, **** p < 0.0001).

