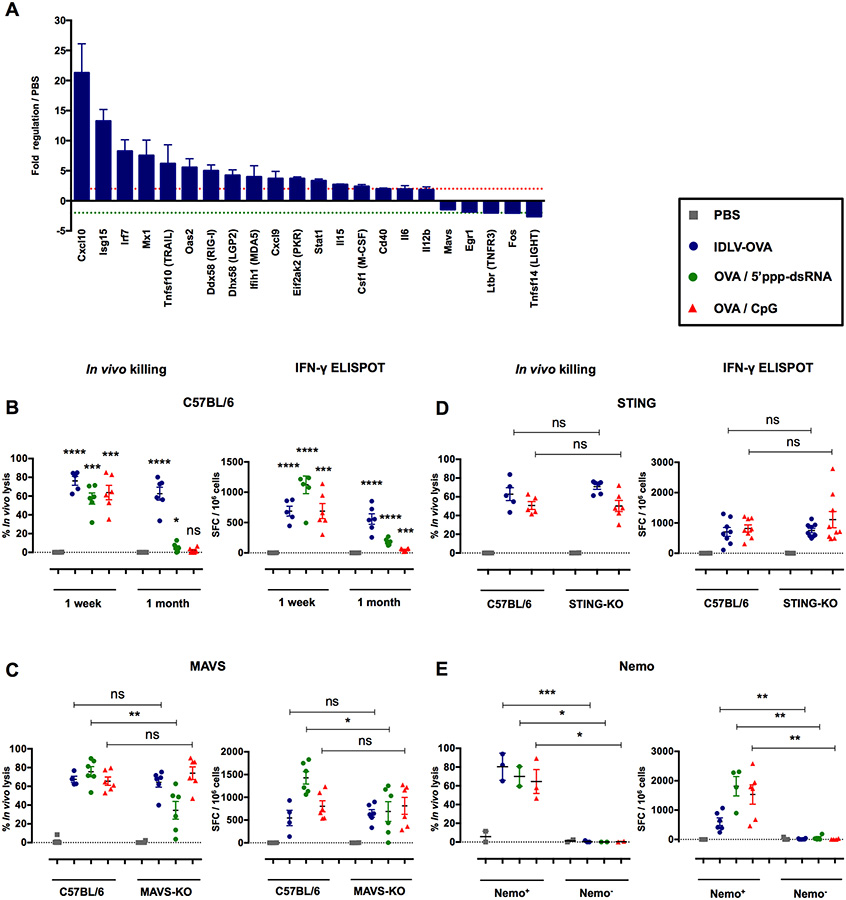
Figure 6. The induction of CTL responses by IDLV-OVA is RIG-I and STING-independent, but depends upon the NF-κB pathway.
(A) C57BL/6 mice were injected i.v. with PBS or 5×10⁶ TUs IDLV-GFP. Four hours after injection, CD11c+ splenic cells were sorted, and the pathways involved in antiviral responses and NF-κB signaling were analyzed using the RT2 profiler PCR array. The results are expressed as the means ± SEM of fold regulation compared to PBS-injected mice, and represent the cumulative data from two mice from two independent experiments. The green dashed line represents a threshold of two-fold downregulation and the red dashed line represents a threshold of two-fold upregulation. C57BL/6 (B), MAVS−/− (C), STING−/− (D) and CD11c-Cre × Nemo flox (E) mice were injected i.v. with PBS, 106 TUs IDLV-OVA, OVA/5’ppp-dsRNA or OVA/CpG. Seven days (B-E) or one month (B) later, anti-OVA CTL responses were assessed by an in vivo killing assay (left panels) and IFN-γ ELISPOT (right panels). The results are expressed as the percentage of specific lysis for the in vivo killing assay and IFN-γ SFC per 106 splenocytes for ELISPOT. Each dot represents an individual mouse. The results represent the means ± SEM of cumulative data from 3 to 9 mice from two to three independent experiments (B-D) or 2 to 6 mice from two independent experiments (E). Nemo+ mice were born from the crossing of CD11c-Cre littermate non transgenic mice × Nemo flox mice. In contrast, Nemo− mice were born from the crossing of CD11c-Cre transgenic mice × Nemo flox mice. Statistical analysis was performed by unpaired Student’s t-test in comparison with PBS-treated mice or between control and deficient mice, as indicated by the horizontal bars (ns p > 0.05, * p < 0.05, ** p < 0.01, *** p < 0.001, **** p < 0.0001). See also Figures S7, S8 and S9.

