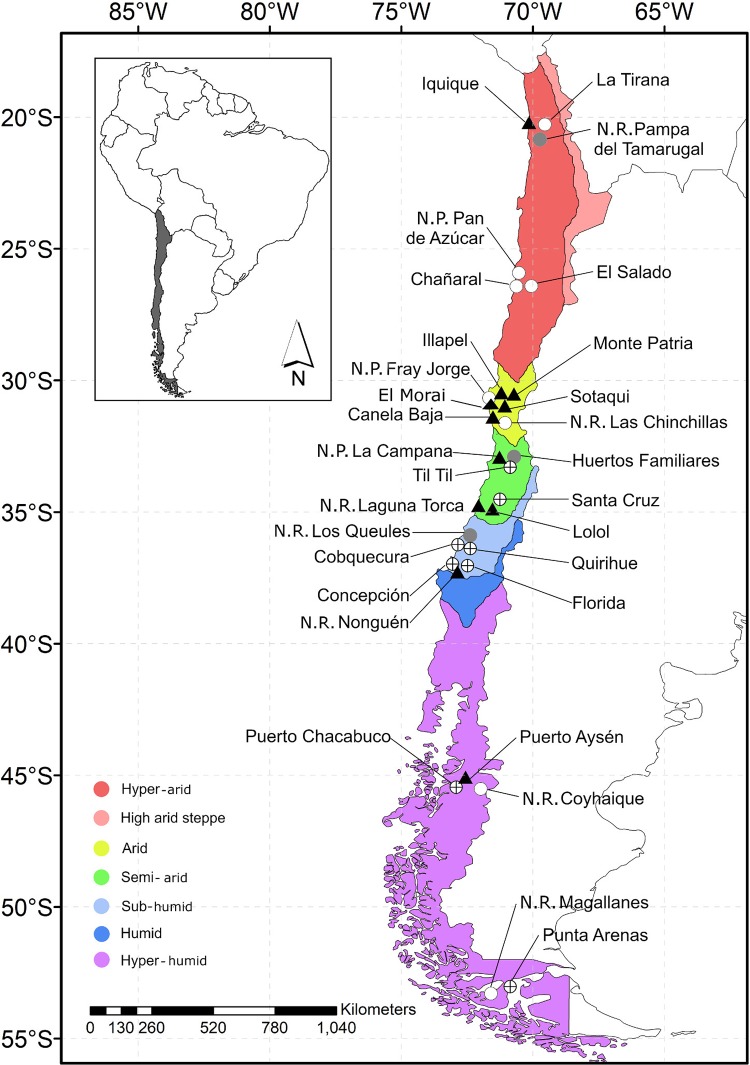
Figure 1. Map of Chile indicating the location of the study sites.
Each data point indicates sample locality. Gray circle: locality featuring rats without fleas; circle with a cross: locality featuring rats with fleas; black triangle: locality featuring fleas that tested positive for Bartonella DNA; white circle: locality without rats.

