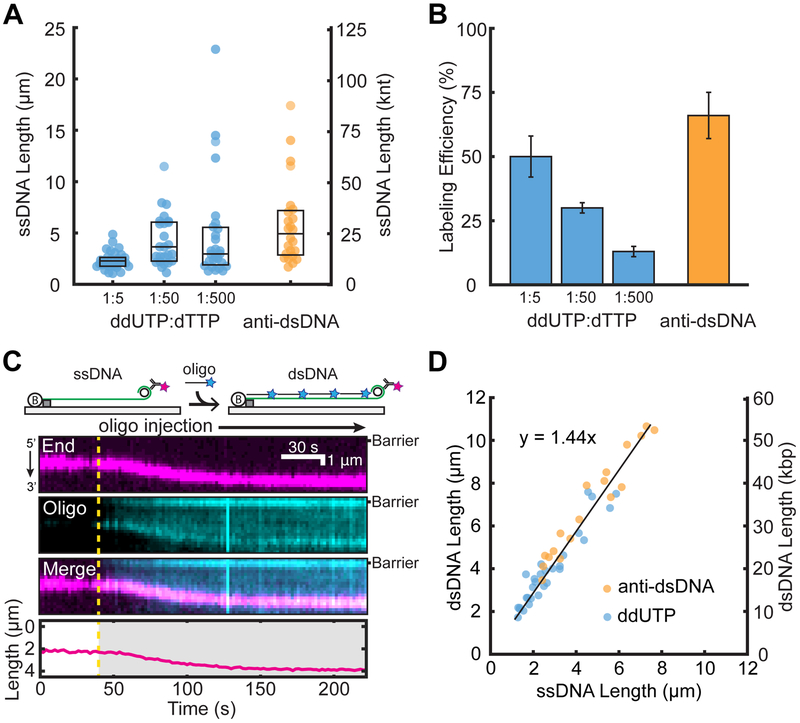
Figure 2.
Efficient end-labeling and length calibration of low-complexity ssDNAs. Comparison of (A) ssDNA lengths and (B) ssDNA end-labeling efficiencies following treatment with ddUTP-dig or fluorescent antibodies. Box plots denote the first and third quartiles of the data. Error bars represent the standard deviation of the labeling efficiency across at least three flow-cell experiments. (C) Cartoon illustration (top) and a representative kymograph of ssDNA (magenta labels the 3′ end) elongated following the injection of a complementary oligo (cyan). The DNA length was tracked by fitting the 3′-end signal (bottom). The dashed line represents the oligo injection time. (D) The ssDNA to dsDNA length change was quantified by either antidigoxigenin ddUTP (blue) or anti-dsDNA (orange). Experimental data were fit to a line (black) with a slope of 1.44 ± 0.05.

