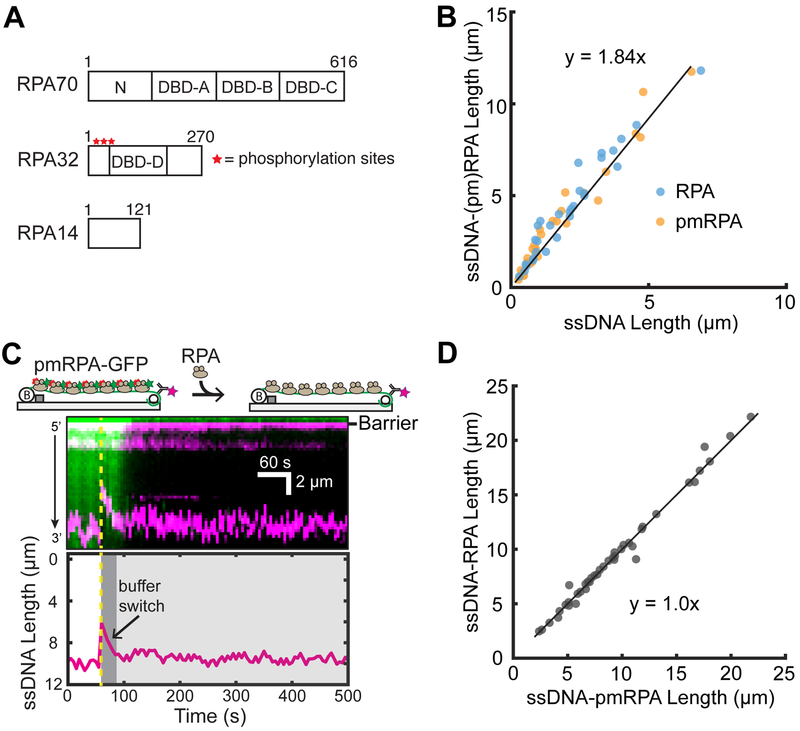
Figure 4.
Analysis of RPA binding modes on ssDNA. (A) Schematic of the DNA binding domains (DBDs) of the heterotrimeric RPA. Red stars denote the approximate locations of eight phosphorylation sites of RPA32. (B) Both RPA and pmRPA extend the ssDNA to a similar extent. The solid black line is a linear fit to both RPA (N = 31 molecules) and pmRPA (N = 34 molecules). (C) Cartoon (top) and kymograph of ssDNA-bound pmRPA-GFP (green) as it is replaced by wt RPA (unlabeled). The corresponding change in the DNA length is shown in magenta. The dashed yellow line denotes when pmRPA-GFP was replaced with RPA in the buffer. (Bottom) ssDNA end-labeled tracking. (D) Scatter plot of ssDNA length with pmRPA and RPA. The solid black line is a linear analysis of more than three flow cells (N = 41 DNA molecules).

